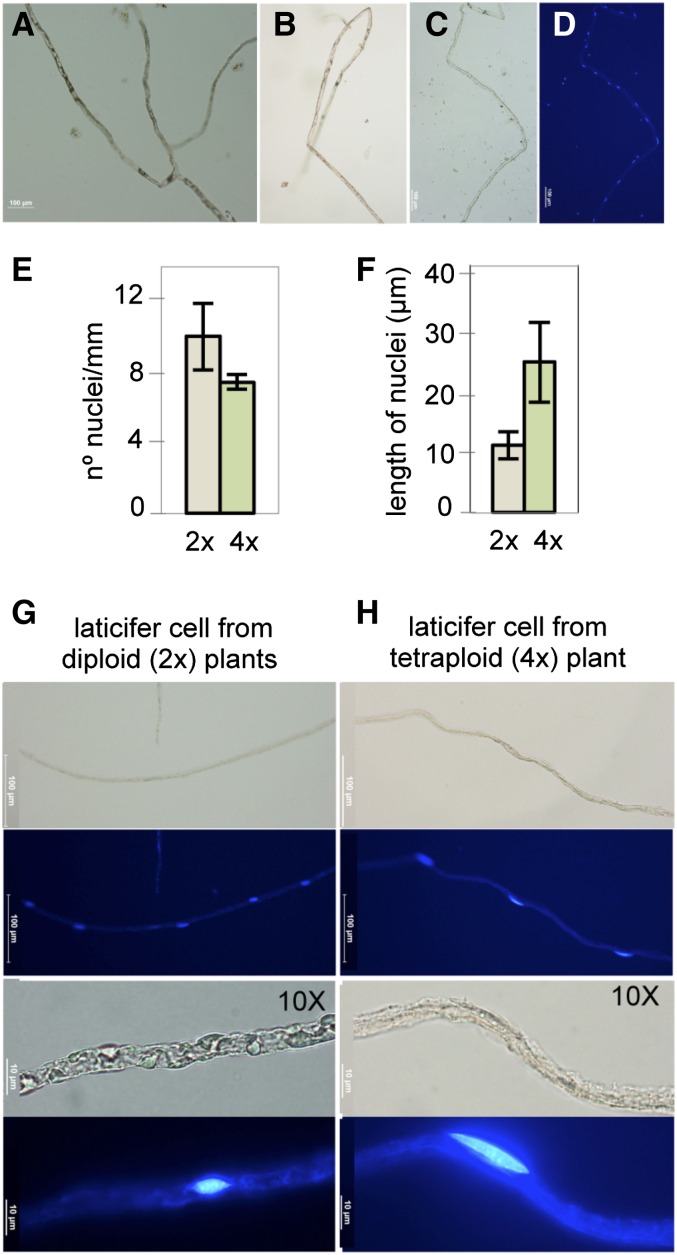
Figure 2.
Isolation of coenocytic laticifer E. lathyris protoplasts and distribution of nuclei. A to D, Fragments of different long individual laticifer protoplast, either with bifurcations or lineal, viewed under the optical microscope (A–C) or by fluorescence microscopy upon staining with DAPI (D). E, Nuclear density along the longitudinal laticifer protoplasts from a diploid (2x) and a tetraploid (4x) plant. F, Length of nuclei from 2x and 4x plants. Bars represent mean ± sd. For nuclear density, 40 individual laticifer protoplasts of different lengths were analyzed. For nuclear length determination, 100 different nuclei from 10 different laticifer cells were measured. G and H, Magnification details of isolated laticifer protoplasts from 2x and 4x plants.

