Figure 5.
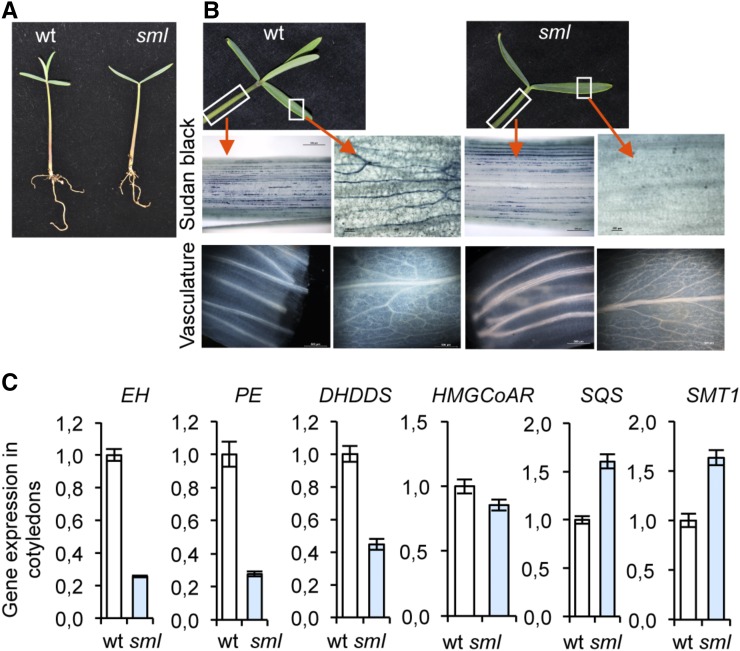
Influence of the SAM on laticifer growth in the cotyledon of E. lathyris. A, Developing seedlings from wild type and the sml mutant. Observe the lack of true leaf formation in the mutant. B, Close-up of the cotyledons and hypocotyls from wild type and sml mutant. Below is shown the presence and disposition of laticifers (top) and the vascular strands and venation pattern (bottom) in each genetic background and for both organs, and as revealed by whole-mount staining with Sudan Black B or upon acetone clarification, respectively, and visualization under the light microscope. C, Expression of the EH, PE, DHDDS, HMGCoAR, SQS, and SMT1 genes in cotyledons from wild-type and sml plants. Relative expression was assayed by RT-qPCR on total RNA from leaves at the indicated stages. Data represent means ± sd (n = 3 biological replicates). Expression was normalized to the constitutive Histone H3 gene, then to expression attained in wild-type plants.

