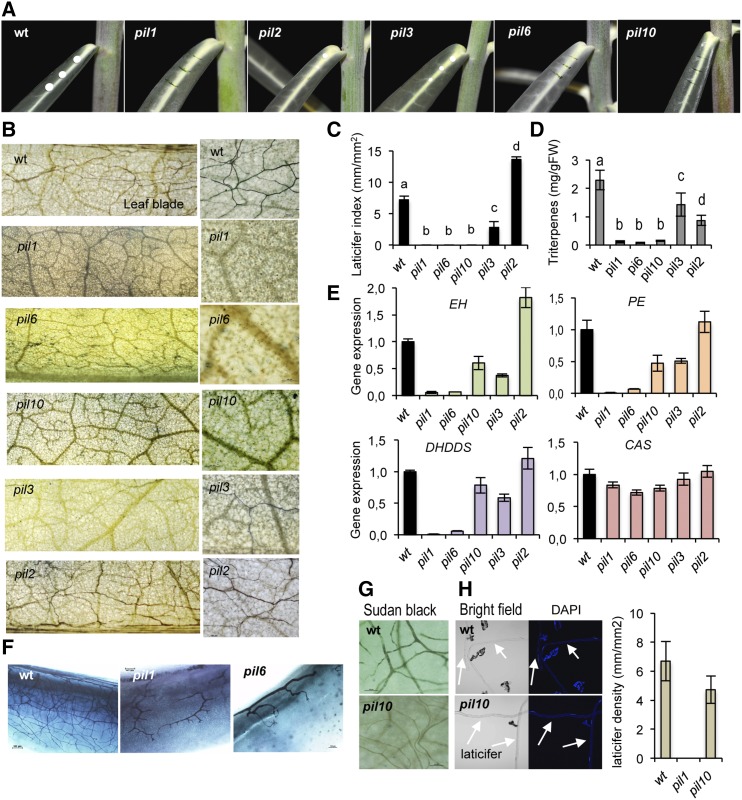
Figure 6.
Characterization of E. lathyris pil mutants. A, Comparative oozing of latex upon pricking of leaves from wild-type, pil1, pil2, pil3, pil6, and pil10 plants. B, Whole-mount Sudan Black B staining of leaves and close-up of a sector of the leaf blade, showing the relative abundance of laticifer cells in the indicated genetic backgrounds. C, Comparison of LI as recorded in leaves located at the same position in plants of the indicated genetic backgrounds. D, Triterpenoid content in leaves from wild-type plants and the pil mutants. Bars represent mean ± sd, n = 9 independent plants. E, Expression of the EH, PE, DHDDS, and CAS genes in leaves from wild-type plants and pil mutants. Relative expression was assayed by RT-qPCR on total RNA from leaves of the indicated genotypes. Data represent means ± sd (n = 3 biological replicates). Expression was normalized to the constitutive Histone H3 gene, then to expression attained in wild-type plants. F, Whole-mount preparation of emerging leaves close to the apical meristem showing defective laticifer elongation in pil1 and pil6 mutants. G, Presence of laticifer cells in leaves of pil10 plants, with a density similar to that observed in wild-type plants, as revealed under the optical microscope upon Sudan Black B staining, intense clarification with ethanol, and illumination with white bright light. H, Long individual laticifer protoplast fragments released from wild-type plants and pil10 plants view under bright field in the optical microscope (left) or by fluorescence microscopy upon staining with DAPI (right). An estimation of laticifer density (mm of longitudinal protoplast released to the medium per optical surface area recorded) from independent protoplast preparations (n = 4) from wild-type and pil10 leaves is shown at the right. The pil1 mutant was used as a negative control revealing the lack of laticifer protoplast released to the medium in this mutant.

