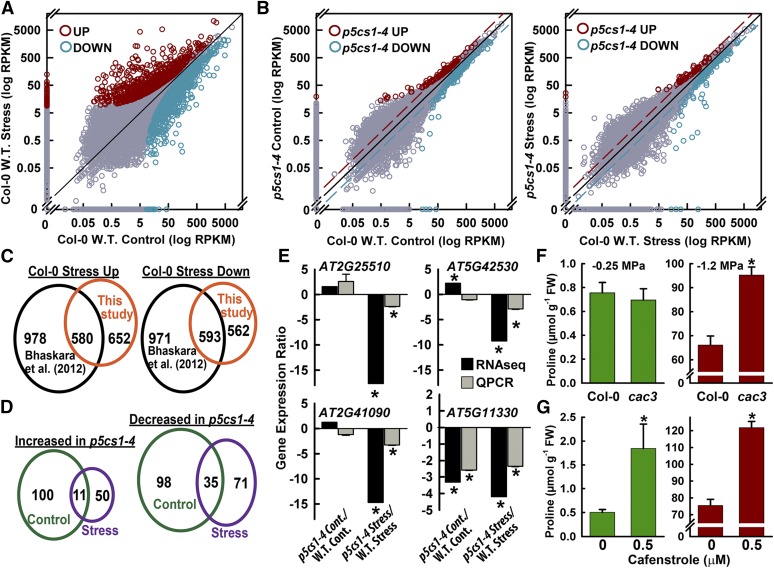
Figure 7.
RNA sequencing of the Col-0 wild type (W.T.) and p5cs1-4 shows the effects of Pro on chloroplast and mitochondria metabolism and identifies additional lipid metabolism loci affecting Pro accumulation. A, Plot of reads assigned per kilobase of target per million mapped reads (RPKM) values for Col-0 in the unstressed control versus Col-0 after 96 h of low-ψw (−1.2 MPa) treatment. Significantly up- or down-regulated genes are indicated by red or blue circles, respectively, while other data points are plotted in gray. A complete listing of RPKM values can be found in Supplemental Table S1, and lists of significantly up- or down-regulated genes as well as significantly enriched Gene Ontology (GO) terms can be found in Supplemental Tables S2 and S3. B, Plots of RPKM values for p5cs1-4 versus the Col-0 wild type in the unstressed control treatment and after 96 h of low-ψw treatment. Data presentation is as described for A. A complete listing of RPKM values can be found in Supplemental Table S1, and lists of significantly up- or down-regulated genes in p5cs1-4 in both control and stress treatments along with a listing of significantly enriched GO terms can be found in Supplemental Tables S4 to S7. Dashed lines indicate two-fold difference in RPKM. C, Comparison of low-ψw up- or down-regulated genes identified by RNA sequencing with those identified by previous microarray analysis of the same stress treatment. D, Comparison of genes up- or down-regulated in p5cs1-4 in the control and low-ψw stress treatments. E, Comparison of fold change in gene expression detected by RNA sequencing versus fold change detected by quantitative PCR (qPCR) for selected genes down-regulated in p5cs1-4. qPCR data are means ± se (n = 5–6) from two experiments. Ratios significantly different (P ≥ 0.05) from 1 based on a one-sided Student’s t test are indicated with asterisks. F, Pro levels in unstressed control treatment (−0.25 MPa) or after 96 h of low-ψw treatment (−1.2 MPa) for the Col-0 wild type and the cac3 mutant. FW, Fresh weight. Data are means ± se (n = 15–18) from three experiments. A significant difference (P ≥ 0.05) compared with the wild type in the same treatment is marked with an asterisk. G, Effects of the KCS inhibitor cafenstrole on Pro accumulation at high or low ψw. Data are means ± se (n = 15–18) from three experiments. Significant differences (P ≥ 0.05) compared with the wild type in the same treatment are marked with asterisks.

