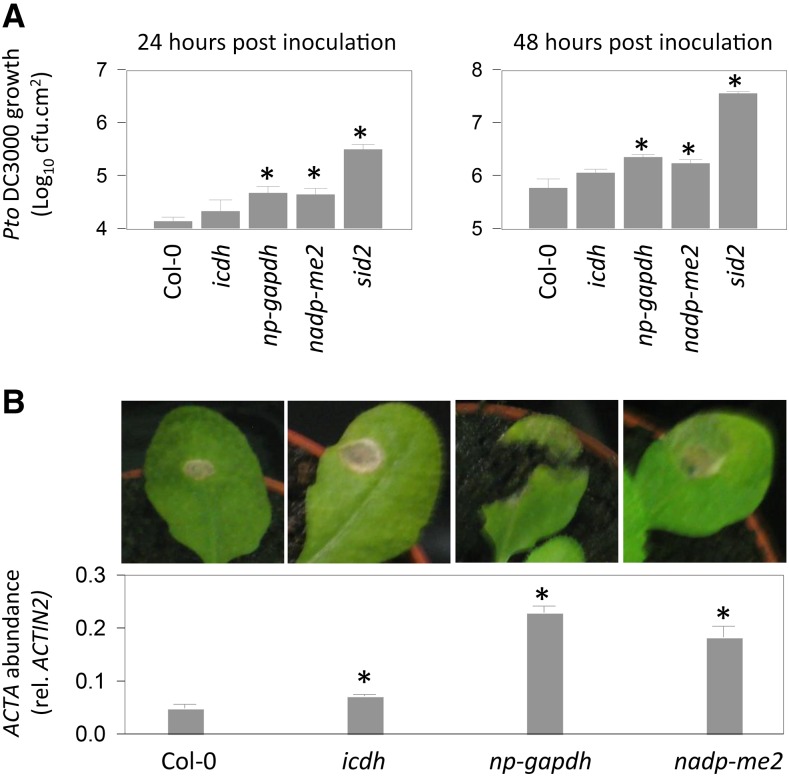
Figure 10.
Resistance to pathogens in mutants for NADP-linked dehydrogenases. All experiments were performed on plants grown at high CO2 as in Figure 3. A, Growth of Pto DC3000 in Col-0 and the mutant lines at 24 and 48 h after inoculation at high CO2. The sid2 mutant was included in the experiment for comparison. cfu, Colony-forming units. B, Representative photographs (top) and fungal ACTIN A transcript abundance (bottom) in leaves of Col-0 and mutants inoculated with B. cinerea. Data are means ± se of three (B) or four (A) biological replicates. Asterisks indicate significant differences between infiltrated and control at P < 0.05.

