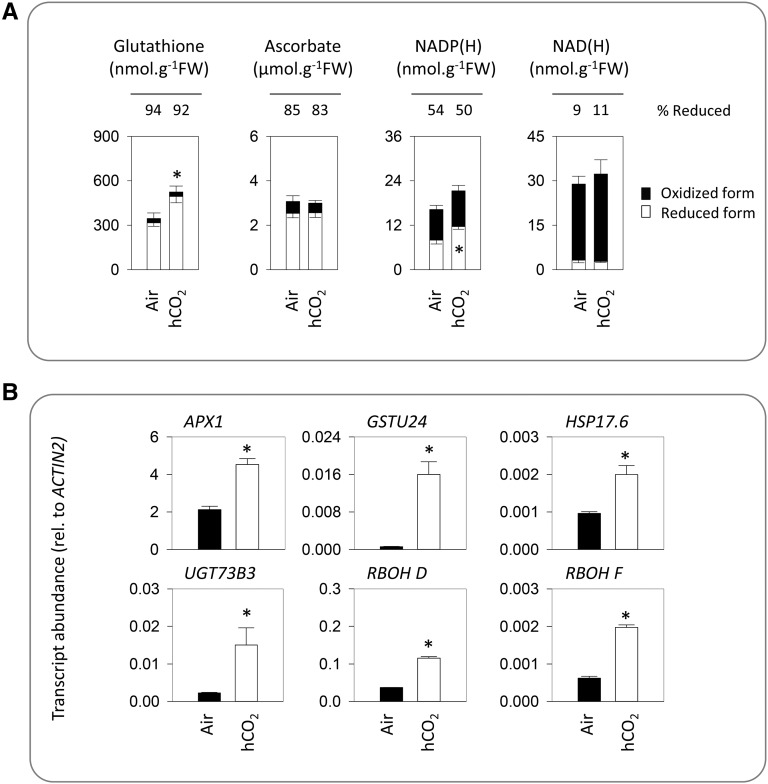
Figure 6.
Redox profiles and ROS signaling in high CO2 (hCO2). Plants were grown as in Figure 3. A, Major antioxidants and pyridine nucleotides. White bars indicate reduced forms, and black bars indicate oxidized forms. Data are means ± se of four biological replicates. Redox states are indicated above the bars as the percentage of each compound found in the reduced form. Significant differences between conditions at P < 0.05 were found in total glutathione content and NADPH (reduced form), as indicated by asterisks. No significant differences in reduction states were found. FW, Fresh weight. B, Abundance of transcripts for ROS-inducible genes and NADPH oxidases. Data are means ± se of three biological replicates. Significant differences between the conditions at P < 0.05 are indicated by asterisks.

