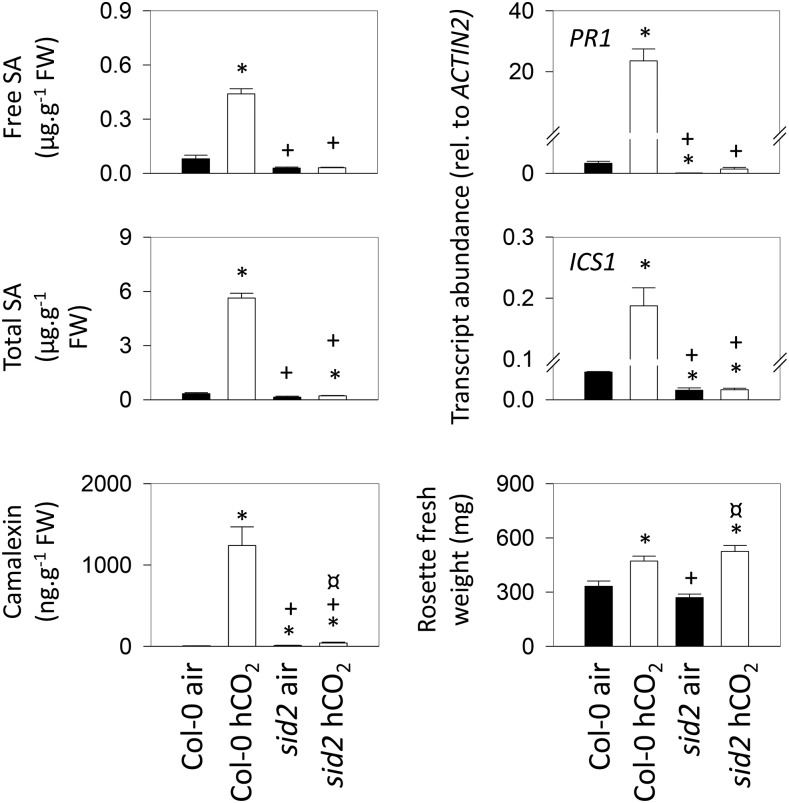
Figure 7.
Comparison of high-CO2 (hCO2) responses in Col-0 and the sid2 mutant. Plants were grown as in Figure 3. Asterisks indicate significant differences at P < 0.05 relative to Col-0 grown in air; plus signs indicate significant differences at P < 0.05 relative to Col-0 grown in high CO2; and crossed circles indicate significant differences at P < 0.05 relative to sid2 grown in air. FW, Fresh weight.

