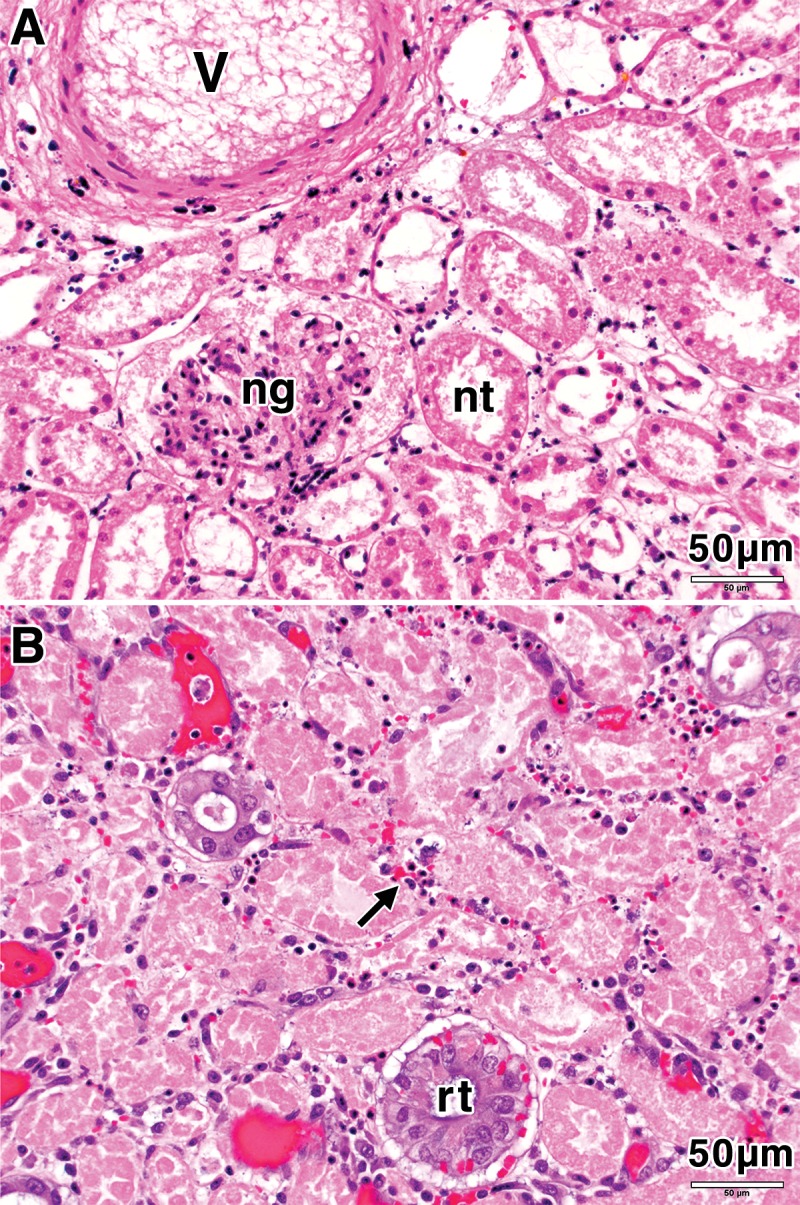
Figure 4:

Photomicrographs (H-E stain; original magnification, ×100) of porcine kidney tissue 7 days after treatment (with 415 mW). A, High-power view of the treatment zone shows necrosis of kidney tubules (nt), a necrotic glomerulus (ng), and a necrotic blood vessel (v). B, High-power view in the zone of fibrotic change shows regenerating tubules (rt) and inflammatory infiltrate (arrow).
