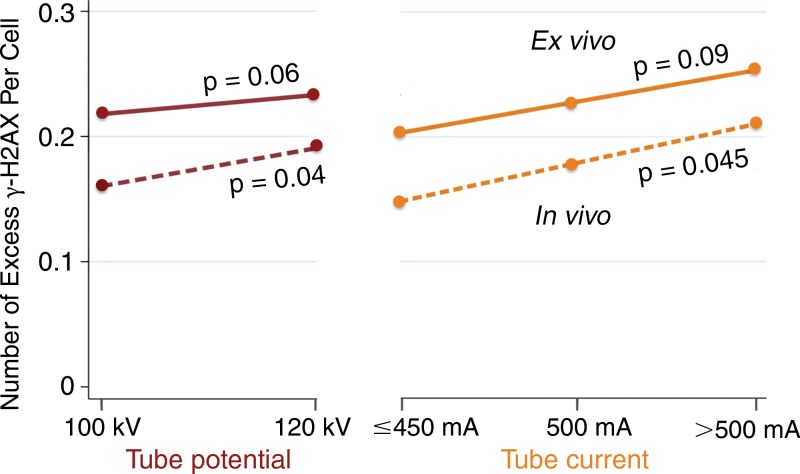
Figure 6:
Graph shows effect of CT angiography settings on excess γ-H2AX foci. Demonstrates increase in excess γ-H2AX foci per cell with increasing tube potential and range of tube current. Dot values represent an average of excess foci per cell among ex vivo (solid line) and in vivo (dashed line) samples. P values are unadjusted, between group comparisons by Student t test (tube potential) and one-way analysis of variance for multiple groups (tube current).

