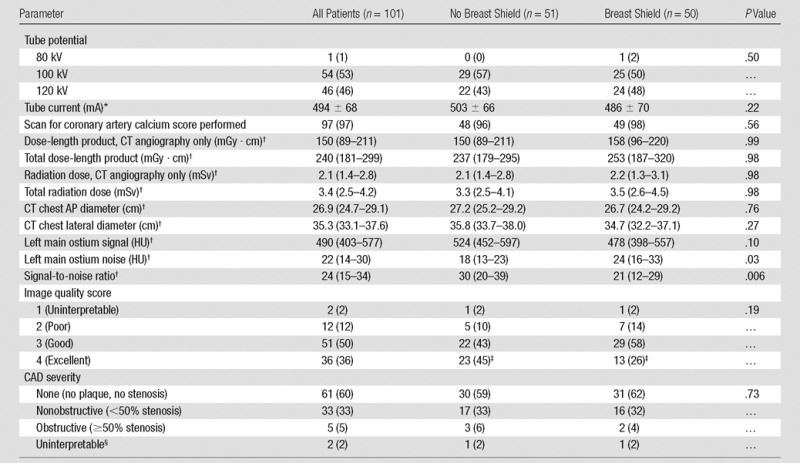
Table 2.
CT Angiography Settings and Results

Note.—Data are numerators with percentages in parentheses unless otherwise indicated. AP = anterior-posterior, CAD = coronary artery disease.
*Data are mean ± standard deviation.
†Data are median; data in parentheses are interquartile range.
‡P value is .045 by comparing the frequency of image quality ratings of excellent between groups.
§Uninterpretable study defined as ≥1 uninterpretable coronary segment.
