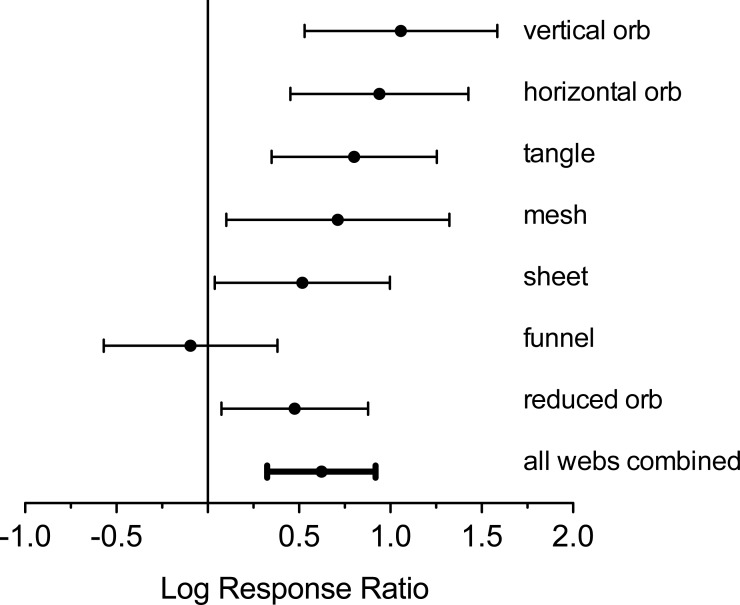
Figure 4. Log response ratio (ratios of number of webs in exclosure plots compared to paired control plots) and 95% confidence intervals for all web types.
Positive values indicate greater web density in the absence of deer. Confidence intervals that intercept zero indicate no significant difference (P > 0.05).

