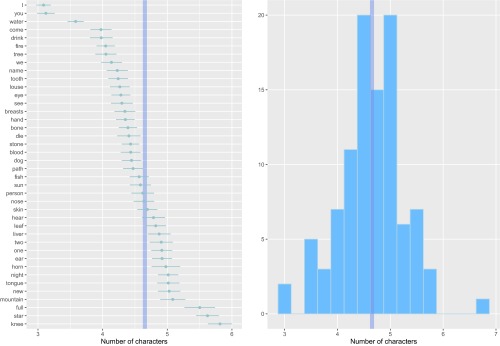
Fig. S1.
On the Left, genealogically balanced average of the number of characters for each of the 40 concepts with most coverage in ASJP. The horizontal bars represent approximate 95% CI for the average. On the Right, distribution of the genealogically balanced average for all of the concepts in ASJP. In both graphs, the vertical blue bar represents the mean value across all concepts in ASJP.

