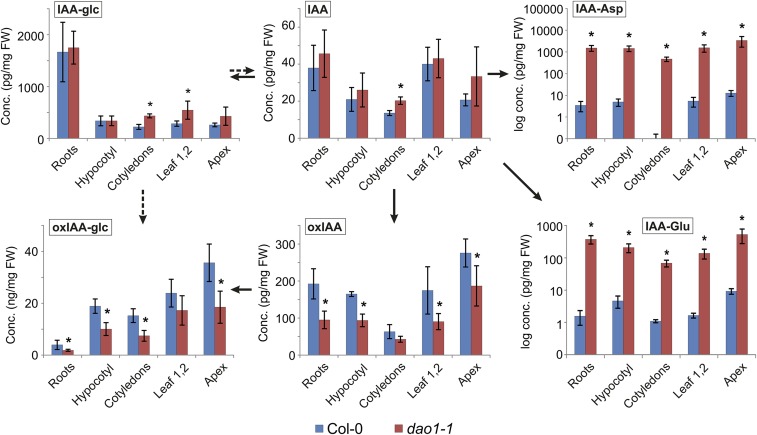
Fig. S7.
Levels of IAA metabolites in different tissues of WT Col-0 and dao1-1 seedlings. IAA and the IAA metabolites oxIAA, oxIAA-glc, IAA-glc, IAA-Asp, and IAA-Glu were quantified in root, hypocotyl, cotyledons, leaves 1 and 2, and shoot apex tissues from 10-d-old Col-0 (blue) and dao1-1 mutant (red) seedlings. The concentrations for all metabolites are given in picograms per milligram fresh weight (FW) or nanograms per milligram FW (IAA-Asp and IAA-Glu are given in log scale). Samples were analyzed in five independent biological replicates, and error bars represent SDs. *Statistically significant differences from Col-0 (P < 0.05; Student’s t test).

