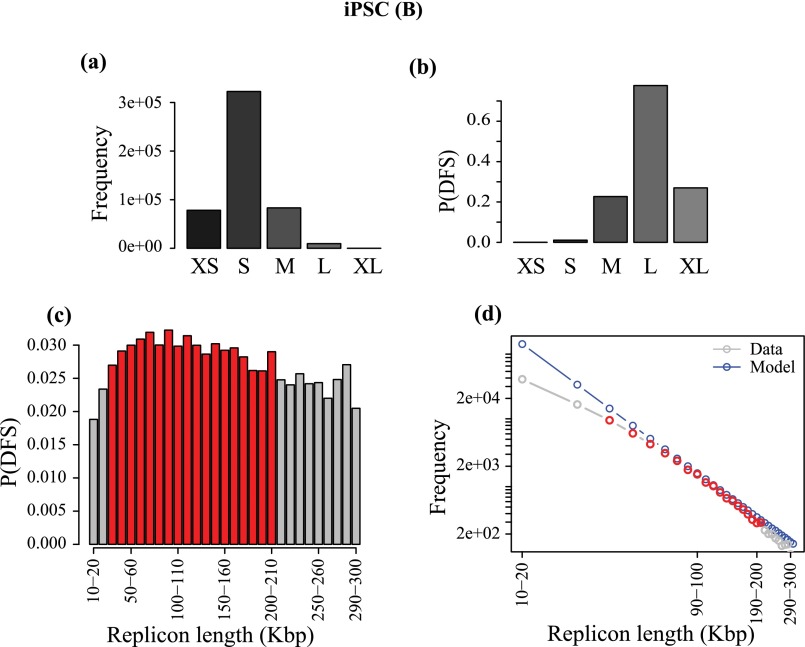
Fig. S4.
Data are from iPSC human dataset in B. (A) Frequency of replicons in each cohort, defined according to the following size ranges: <103 bp, XS; 103 to 104 bp, S; 104 to 105 bp, M; 105 to 106 bp, L; and >106 bp, XL. (B) Probability of DFS in each cohort of the replicons. (C) Higher-resolution plot of probability of DFS at the transition from M to L gap cohorts contributing most toward the P(DFS); red bars show the bins with maximum P(DFS) in respective datasets. (D) Theoretical frequency distribution of replicons inferred from C are presented in blue; gray shows the actual frequency distribution in those bins in the data, and red highlights the red bins in C.

