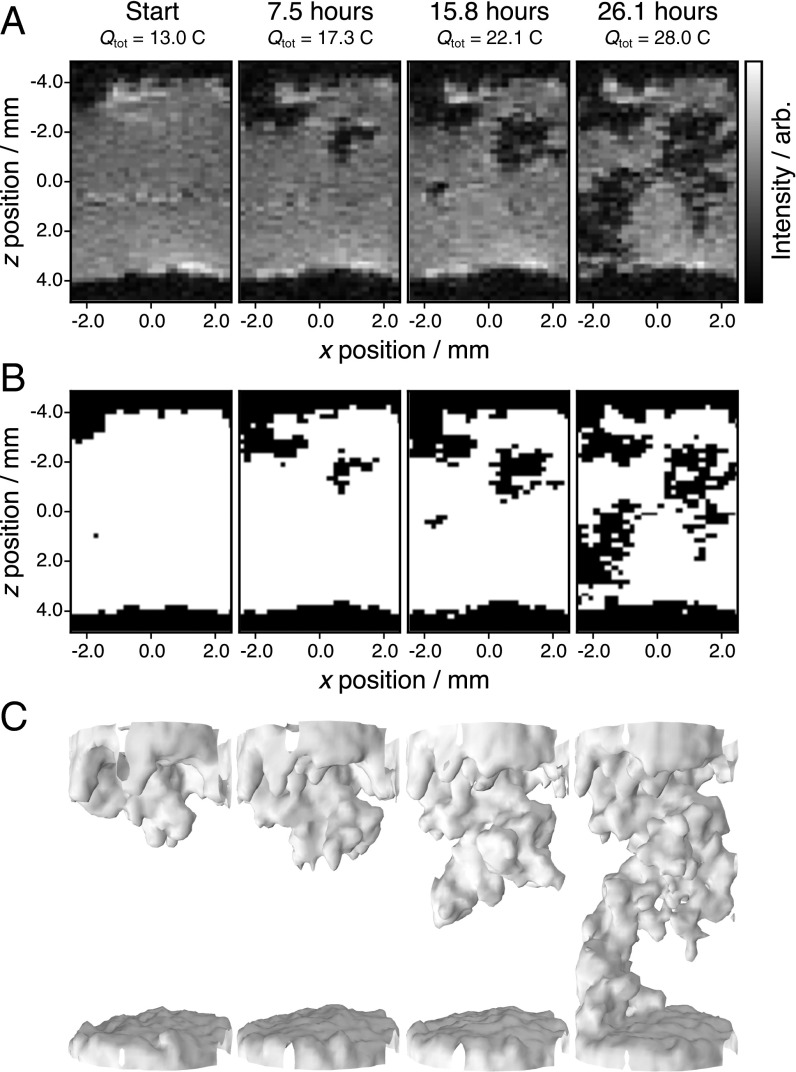
Fig. 1.
In situ 1H 3D FLASH imaging results from the electrochemical cell, with each 3D image acquired in 16 min 40 s. The cell was charged at 50 μA (0.16 mA cm−2) for 72 h before these measurements and then charged at 160 μA (0.51 mA cm−2) for the times specified, with the total charge applied also given in coulombs. (A) Two-dimensional slices from four time points. (B) Segmented images of the results from A, where . (C) Three-dimensional segmented images of the same time points with an additional Gaussian filter applied to smoothen the visualization.

