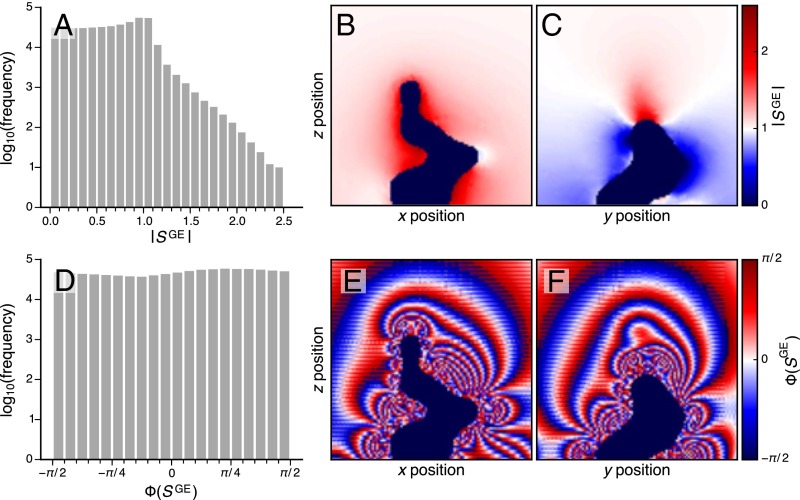
Fig. 5.
Results from the signal intensity and phase calculations. (A and D) Log-scale histograms for the amplitude and phase of the detected signal across the whole voxel. (B, C, E, and F) Maps of the amplitude (B and C) and phase (E and F) of the detected signal in two orthogonal slices through the voxel.

