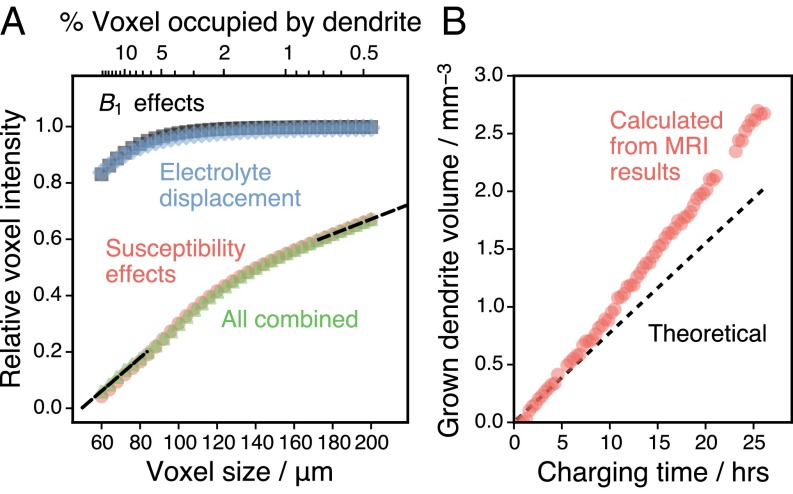
Fig. 6.
Analysis of calculated voxel size effects. (A) Calculated signal attenuations for differently sized voxels, given relative to the maximum signal for each cell size. Contributions of different sources of signal attenuation are calculated separately (for alone and for susceptibility alone for all , with both conditions used to isolate displacement effects). Black dashed lines illustrate the linear extrapolation of the combined results. (B) Comparison between the calculated and theoretical dendrite volume in the battery throughout the experimental time series. Numerical errors associated with the calculated dendrite volume are within the marker size.

