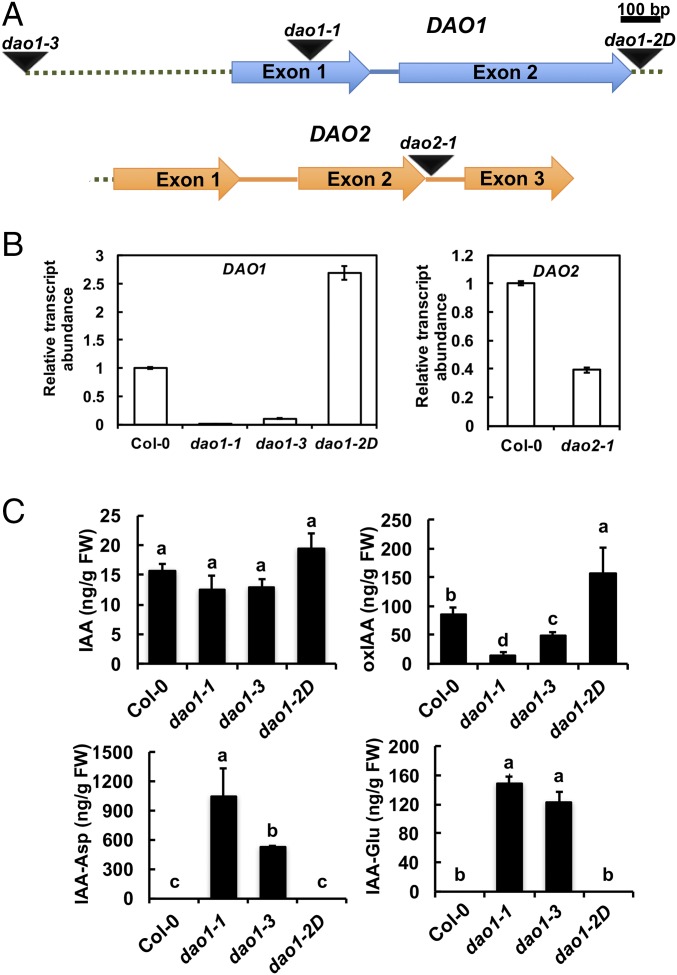
Fig. 2.
Identification of DAO1 and DAO2 T-DNA insertion lines. (A) Gene organization and schematic representation of T-DNA insertion lines of DAO1 (At1G14130) and DAO2 (At1G14120). Arrows, exons; dotted line, 1,091-bp interval between DAO1 stop codon and DAO2 start codon; intervening lines, introns; triangles, T-DNA sites. (B) Transcript abundance of DAO1 and DAO2 in mutants compared with Col-0. (C) IAA and IAA metabolite concentrations in 7-d-old Col-0 (wild type) and mutant seedlings. Data are means ± SD of at least four biological repeats. Different letters indicate statistical significance (ANOVA; P < 0.05). FW, fresh weight.

