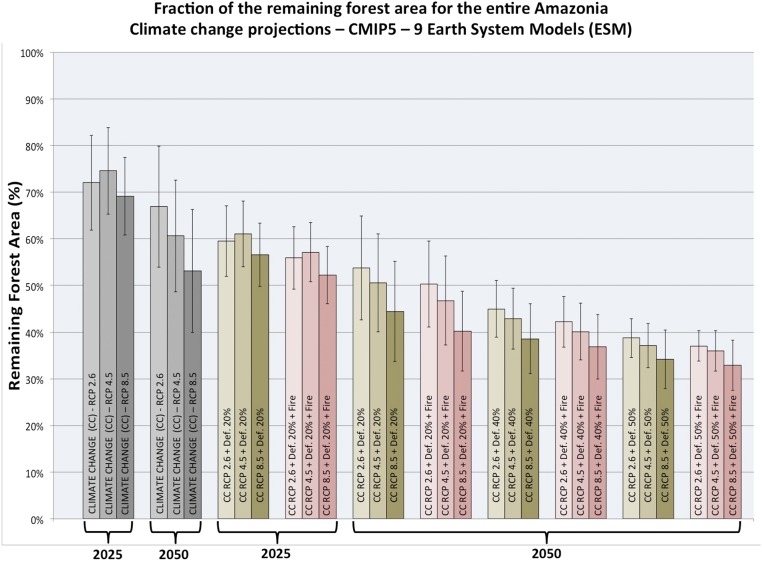
Fig. S1.
Fraction of area with remaining forest for the entire Amazon as a function of scenarios of climate change only (gray bars) and combined climate change + deforestation (moss green bars) and climate change + deforestation + fire effect (pink bars) for time slices 2020–2030 (labeled “2025”) and 2040–2060 (labeled “2050”) under 20, 40, and 50% deforestation scenarios and for IPCC AR5 scenarios RCP2.6, RCP4.5, and RCP8.5, and with or without including forest fire effects. The bars and error bars are averages and SD, respectively, for all models results. The CO2 fertilization effect is considered in the calculations by choosing photosynthetic assimilation rate as 25% of the maximum photosynthetic assimilation rate.

