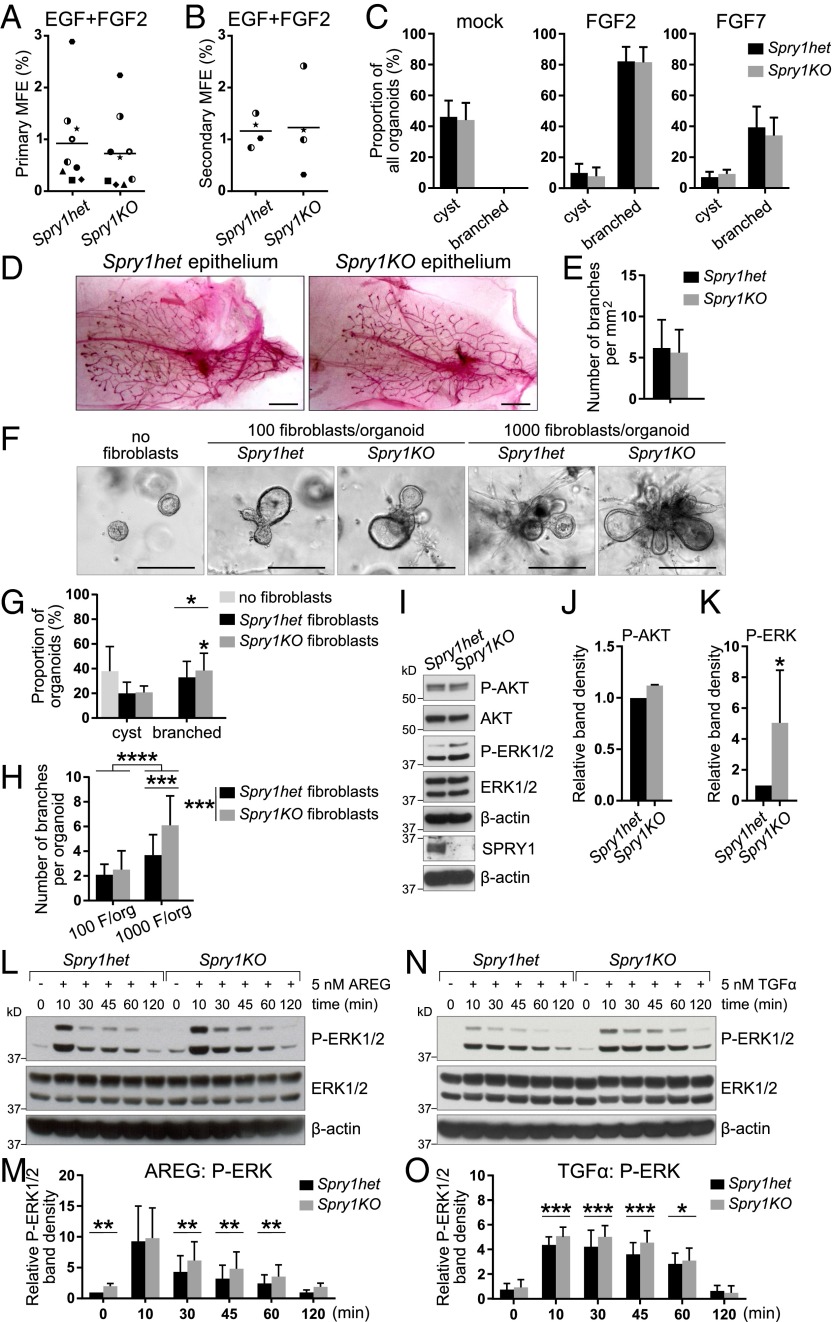
Fig. 2.
Spry1-null fibroblasts are sensitized to AREG/TGFα–ERK signaling and show elevated activities in promoting epithelial branching in vitro. (A and B) Plots depicting primary (A) and secondary (B) mammosphere-forming efficiency (MFE) of Spry1het and Spry1KO basal cells. Data points show paired values, and lines indicate mean (n = 4 or 9). Statistical analysis was performed using paired t test and revealed no significant difference in MFE between Spry1het and Spry1KO basal cells. (C) In vitro branching assay. Spry1het and Spry1KO organoids were cultured in Matrigel in basal organoid medium without any growth factor or supplemented with FGF2 or FGF7. Graphs show frequencies of formation of cysts and branched organoids, presented as mean ± SEM (n = 4). Statistical analysis was performed using paired t test and revealed no significant difference in organoid morphogenesis between Spry1het and Spry1KO basal cells. (D and E) Transplantation of Spry1het and Spry1KO MECs into wild-type fat pads. (D) Representative photographs of whole mounts harvested 5 wk after transplantation and stained with carmine red. (Scale bars, 2.5 mm.) (E) Quantification of epithelial branching. The plot shows mean ± SEM (n = 7 per genotype). Statistical analysis was performed using paired t test and revealed no significant difference in epithelial outgrowths between Spry1het and Spry1KO basal cells. (F–H) In vitro coculture branching assay, in which Spry1het or Spry1KO fibroblasts were cocultured with wild-type organoids [at the ratio of 100 or 1,000 fibroblasts (F) per organoid] in Matrigel in basal organoid medium without addition of growth factors. (F) Representative photographs of organoids in cocultures. (G) The graph shows frequencies of formation of cysts and branched organoids, presented as mean ± SEM (n = 4). Statistical analysis was performed using paired t test; *P < 0.05. (H) The graph shows number of branches per branched organoid, presented as mean ± SD (n = 13–22). Statistical analysis was performed using two-way ANOVA with multiple comparisons; ***P < 0.001; ****P < 0.0001. (I–K) Western blot analysis of the phosphorylation status of AKT and ERK1/2 in Spry1het and Spry1KO fibroblasts cultured in normal medium with serum. (I) P-AKT (Ser473), AKT, P-ERK1/2 (Thr202/Tyr204), ERK, and β-actin signals were detected on a single blot. (J and K) Quantitative comparison of AKT (J) and ERK1/2 (K) phosphorylation. The plots show P-AKT (Ser473) band density, normalized to total AKT (J), and P-ERK1/2 (Thr202/Tyr204) band density, normalized to total ERK1/2 (K), as mean ± SD (n = 3). Statistical analysis was performed using paired t test; *P < 0.05. (L–O) Western blot analysis of phosphorylation status of ERK1/2 in Spry1het and Spry1KO fibroblasts in response to AREG (L and M) or TGFα stimulation (N and O). Fibroblasts were serum-starved, treated with 5 nM AREG or TGFα for the indicated time, and lysed, and on a single blot, P-ERK1/2 (Thr202/Tyr204), ERK, and β-actin signals were detected. (M and O) Quantitative comparison of ERK1/2 phosphorylation, normalized to total ERK1/2. Data are mean ± SD (n = 3–5). Statistical analysis was performed using two-way ANOVA; *P < 0.05; **P < 0.01; ***P < 0.001.

