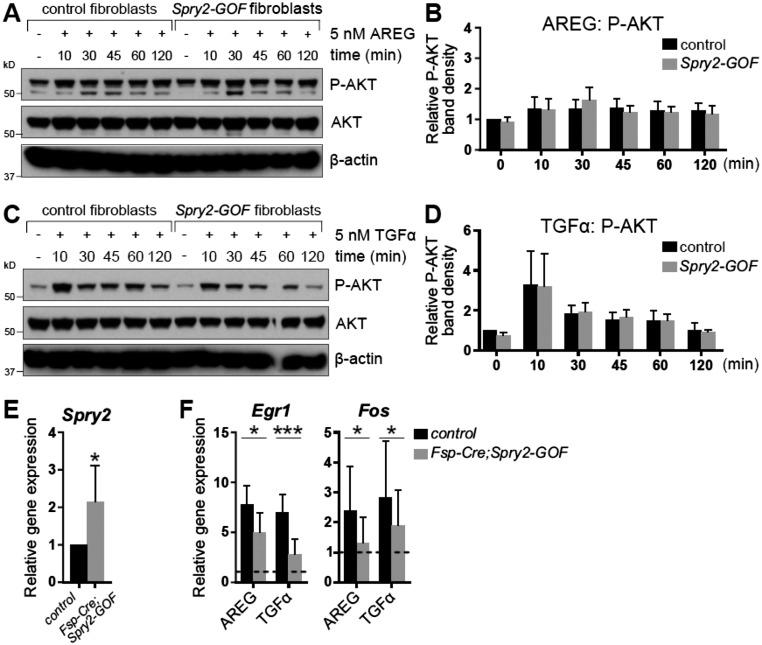
Fig. S5.
AKT phosphorylation is not affected by ectopic expression of Spry2 in mammary fibroblasts. (A–D) Western blot analysis of phosphorylation status of AKT in control and Spry2-GOF fibroblasts in response to AREG (A and B) or TGFα stimulation (C and D). Fibroblasts were serum-starved, treated with 5 nM AREG or TGFα for the indicated durations, and lysed, and on a single blot, P-AKT (Ser473), AKT, and β-actin signals were detected. (B and D) Quantitative comparison of AKT phosphorylation, normalized to total AKT. Data are mean ± SD (n = 2–3). Statistical analysis was performed using two-way ANOVA and revealed no significant difference in P-AKT between control and Spry2-GOF fibroblasts. (E) Relative expression of Spry2 in control and Fsp-Cre;Spry2-GOF fibroblasts, normalized to Actb. The plot shows mean ± SD. Statistical analysis was performed using paired t test; *P < 0.05. (F) Relative expression of Egr1 and Fos in control and Fsp-Cre;Spry2-GOF fibroblasts in response to AREG or TGFα stimulation, normalized to Actb and compared with their expression in mock-treated cells (indicated by dotted line). The plots show mean ± SD. Statistical analysis was performed using two-way ANOVA; *P < 0.05; ***P < 0.001.

