Fig. S1.
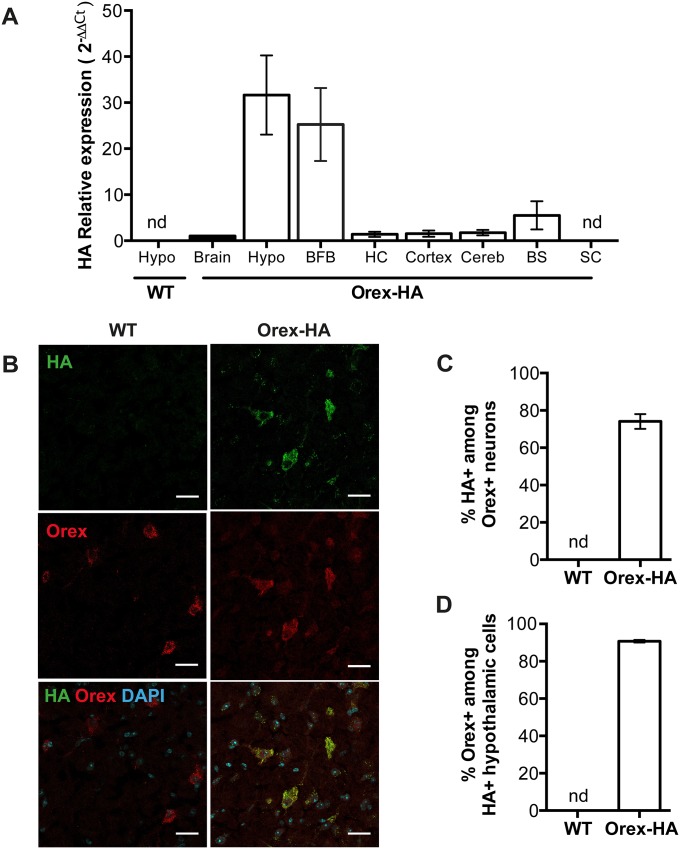
HA is expressed in orexin+ neurons in Orex-HA mice. (A) Detection of HA mRNA expression by quantitative RT-PCR within different brain structures of Orex-HA and WT animals. BFB, basal forebrain; BS, brainstem; Cereb, cerebellum; HC, hippocampus; Hypo, hypothalamus; SC, spinal cord. Results are expressed as mean ± SEM from 5–11 mice per CNS region, from five independent experiments. nd, not detected. (B) Representative immunofluorescence analysis of HA and orexin-A expression in the hypothalamus of WT and Orex-HA animals. Nuclei are labeled with DAPI. Red and green stainings reveal orexin and HA, respectively. (Scale bars: 25 μm.) (C and D) Percentages of HA+ cells among orexin+ neurons (C) and of orexin+ neurons among HA+ cells in the hypothalamus (D). Results are expressed as mean ± SEM of 4–13 mice per group from four independent experiments. nd, not detectable.

