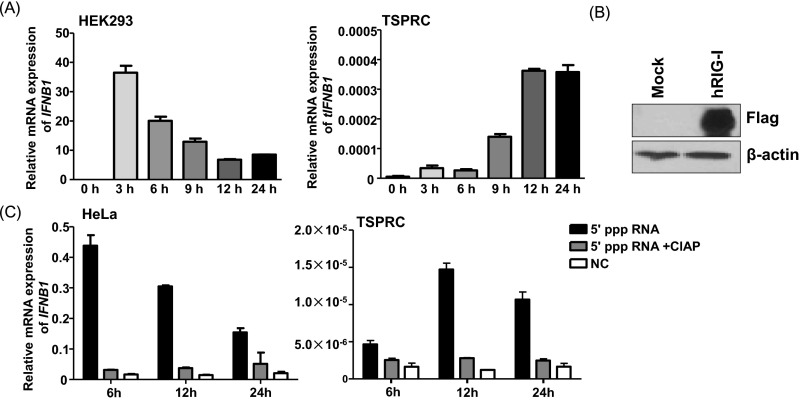
Fig. S2.
HEK293 cells and TSPRCs have a different pattern in response to the NDV infection. (A) Different patterns of IFNB1 mRNA expression in HEK293 and TSPRCs. The TSPRCs or HEK293 cells (1 × 10⁵/well) were grown in 12-well plate overnight and were infected with NDV (Newcastle disease virus; MOI = 10) for the indicated time before the harvest for total RNA isolation. Real-time qPCR was used for measuring the IFNB1 mRNA level. (B) Overexpression of human RIG-I (hRIG-I) in TSPRCs. The TSPRCs (1 × 10⁵/well) were grown in a 12-well plate overnight and were transfected with Flag-tagged hRIG-I expression vector (hRIG-I, 1 μg) or empty vector (Mock, 1 μg). Cells were harvested at 48 h after transfection, and cell lysates were analyzed by immunoblot using the anti-Flag antibody. Blot for β-actin was used as a control. (C) The 5′ ppp RNA up-regulates the IFNB1 mRNA expression in HeLa and TSPRCs with a different time-dependent pattern; 5′ ppp RNA (100 ng/mL) and 5′ ppp RNA treated with CIAP (100 ng/mL) were transfected into 1 × 10⁵ cells for the indicated times, respectively. The IFNB1 mRNA expression levels in cells transfected with 5′ ppp RNA, 5′ ppp RNA treated with CIAP, and nontransfected cells (NCs) were measured by qRT-PCR. Bars represent mean ± SEM. All experiments were repeated for three times, with similar results.

