Fig. 3.
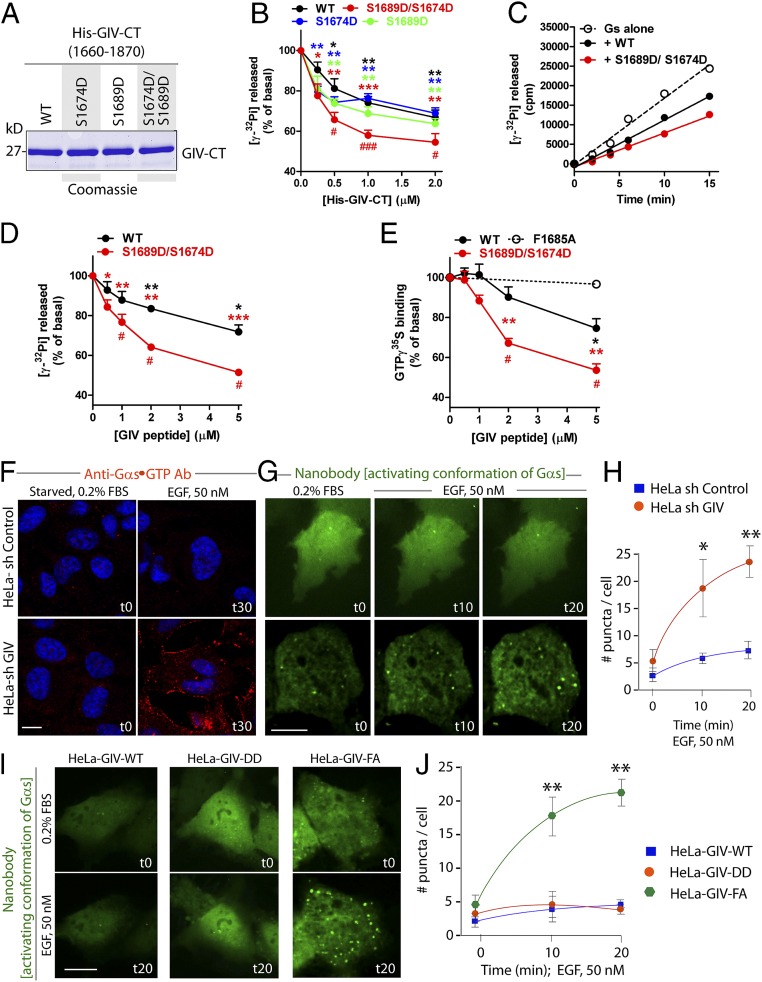
GIV serves as a GDI for Gαs. (A) His-tagged WT C-terminal (amino acids 1660–1870; His-GIV-CT WT) and various phosphomimetic mutants of GIV were purified from bacteria, analyzed by SDS/PAGE, and stained with Coomassie blue. (B) The steady-state GTPase activity of His-Gαs (50 nM) was determined at t15 in the presence of increasing concentrations of purified His-GIV-CT WT (black), S1674D (blue), S1689D (green), or S1674D/S1689D (red). Gαs activity is expressed as percent of the steady-state GTPase activity of Gαs alone in the absence of His-GIV-CT protein. Results are expressed as ± SEM; n = 3. *P < 0.05, **P < 0.01, ***P < 0.001 compared with no GIV; #P < 0.05, ##P < 0.01 compared with GIV WT at the same concentration. (C) The steady-state GTPase activity of His-Gαs (50 nM) was determined by measuring (in counts per minute) the release of radiolabeled phosphate at different time points in the absence (open circles) or presence of 1 μM purified His-GIV-CT WT (solid black circles) or His-GIV-CT S1674D/S1689D (solid red circles). One experiment representative of three is shown. (D) The steady-state GTPase activity of His-Gαs (50 nM) was determined at t15 in the presence of increasing concentrations of a synthetic GIV-derived peptide (amino acids 1671–1705) of WT sequence (black) or containing the S1674D/S1689D mutations (red). Gαs activation is expressed as percent of the steady-state GTPase activity of Gαs alone in the absence of any peptide. Results are expressed as ± SEM; n = 3. *P < 0.05, **P < 0.01, ***P < 0.001 compared with no GIV; #P < 0.05 compared with GIV WT at the same concentration. (E) GTPγS binding by His-Gαs (50 nM) was determined by measuring the incorporation of 35S-radiolabeled nucleotide at t15 in the presence of increasing concentrations GIV-derived peptide (amino acids 1671–1705) of WT sequence (black), containing the DD mutations (red), or the FA mutation (G-protein binding–deficient negative control; dashed line). Results are expressed as ± SEM; n = 3. *P < 0.05, **P < 0.01 compared with no GIV; #P < 0.05 compared with GIV WT at the same concentration. (F) Serum-starved control (shControl) and GIV-depleted (shGIV) HeLa cells were stimulated with 50 nM EGF for 30 min and then were fixed and stained for active Gαs using anti-Gαs⋅GTP (red) and DAPI (to stain the nucleus; blue) and were analyzed by confocal microscopy. (Scale bars, 10 µm.) (G–J) Control (shControl) and GIV-depleted (shGIV) HeLa cells (G and H) or HeLa cells stably expressing GIV-WT or the DD or FA mutants (I and J) expressing GFP-tagged anti–Gαs-GTP (activating) conformation-specific nanobodies were serum starved overnight, stimulated with 50 nM EGF, and analyzed by live-cell imaging using a Leica scanning disk microscope for 20 min. Freeze frames from representative cells are shown in G and I. Bright puncta indicate active Gαs. (Scale bars, 10 µm.) Graphs in H and J show the average number of puncta per cell (y axis) at the indicated time points (x axis) in the experiments shown in G and I, respectively. Results are expressed as ± SEM; n = 3. *P < 0.05, **P < 0.01.

