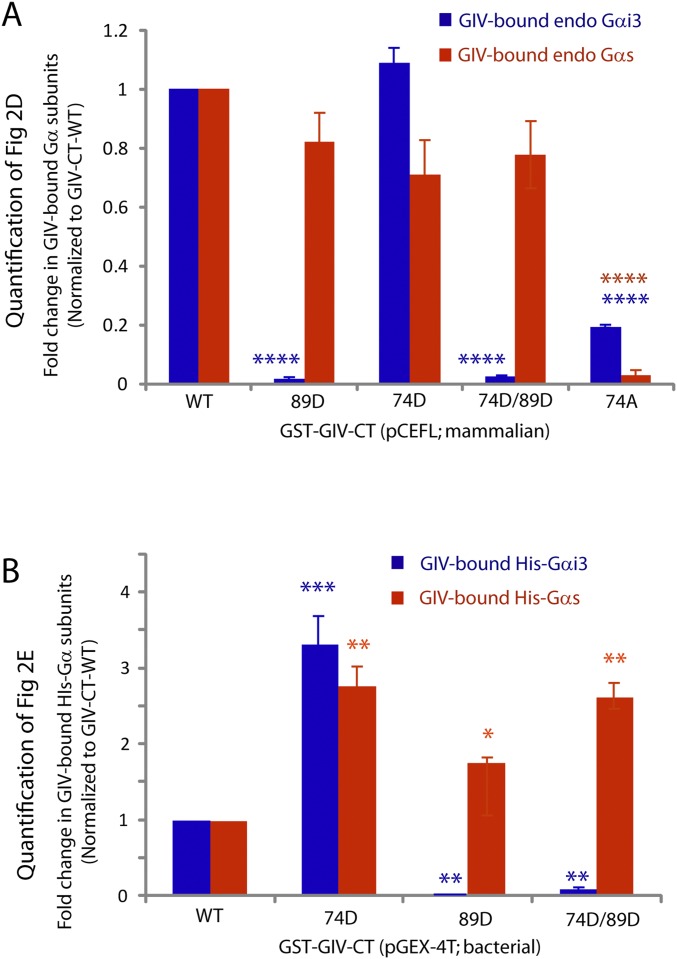
Fig. S3.
Quantification of the amount of endogenous (A) or His-tagged (B) Gαi3 (blue) or Gαs (red) proteins bound to WT or various phosphomimicking mutant GST-GIV-CT proteins. Signal intensities of bands in the immunoblots displayed in Fig. 2 D and E were quantified using LI-COR Odyssey software, normalized to GIV-CT-WT, and displayed here as fold-change in binding (y axis) with various GIV-CT constructs (x axis). Any mutant GIV-CT construct in which the serine at 1689 was mutated to aspartate (89D) showed significantly less binding to Gαi but not to Gαs. Data are presented as mean ± SEM; n = 3. *P < 0.05, **P < 0.01, ***P < 0.001, ****P < 0.0001.

