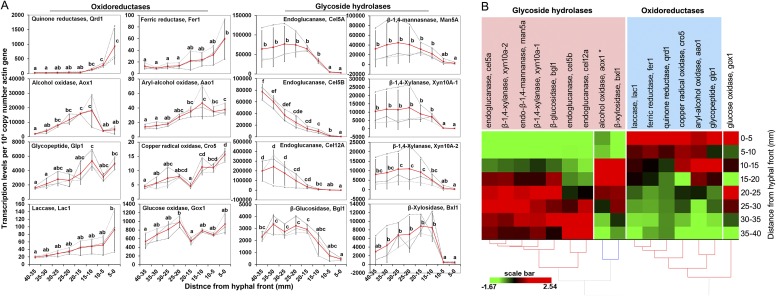
Fig. S2.
Quantitative PCR analysis of gene expression in spruce wafers. (A) Differential expression of oxidoreductase and GH genes in P. placenta as a function of distance from the hyphal front in wafers. (B) Heat map showing that transcripts of oxidoreductases accumulated ahead of GHs as P. placenta-colonized wafers. Transcription levels were assessed using qRT-PCR in samples from eight contiguous wafer sections behind the visible hyphal front. Expression levels of each gene were normalized against β-actin gene and presented as the average of three independent bioreplicates (Note: RNA-seq revealed actin up-regulated 1.8-fold at the front, but could not be applied to normalize quantitative PCR data). Each gray dashed line in A indicates the expression data from one independent wafer, whereas red lines show the mean values. Error bars represent SDs. Significance of differences in expression levels of each gene along the advancing mycelium were calculated with a Tukey honest significant difference (HSD) test (α = 0.05) by using log2 transformation of the data when normalization was required. Letters in A indicate a significant difference between two means (P < 0.05) for each gene. The average expression data for each gene along the advancing hyphal front were normalized and used for hierarchical clustering analysis.

