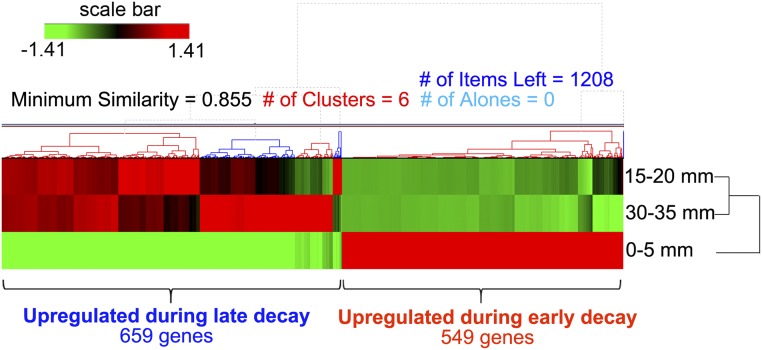
Fig. S4.
Hierarchical clustering analysis of DEGs along the advancing mycelium in aspen wafers. As shown by RNA-seq analysis, 659 genes were up-regulated during late decay (15–20 mm and 30–35 mm), whereas 549 genes were up-regulated during early decay (0–5 mm). Fold changes between early and late decay were greater than fourfold (FDR < 0.05), with FPKM > 5 for all genes included.

