Fig. 2.
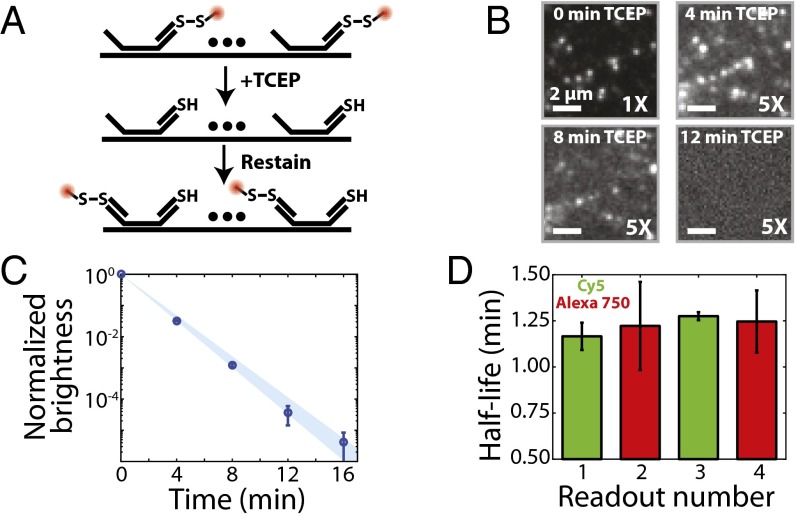
Reductive cleavage of disulfide-linked fluorophores removes the fluorescent signal efficiently. (A) Schematic diagram of the use of TCEP to extinguish the fluorescence signal via cleavage of a disulfide bond linking a fluorescent dye to a readout probe. (B) Images of a region of a human fibroblast (IMR-90) stained with an encoding probe for the FLNA RNA and a readout probe linked to Cy5 via a disulfide bond as a function of time exposed to 50 mM TCEP. Each panel represents the same portion of an FOV. (Scale bars: 2 µm.) Except for the upper left panel, the contrast has been increased fivefold to illustrate better the fluorescent signal remaining in the sample after TCEP treatment. (C) The average brightness of readout probe 1 bound to encoding probes targeting FLNA (normalized to the brightness before TCEP exposure) as a function of the total time of exposure to 50 mM TCEP. Error bars represent SEM (n provided in Fig. S2B), and the blue region represents the 95% confidence interval for a fit to an exponential decay. (D) The measured half-life for the average brightness when exposed to 50 mM TCEP for four readout probes (1–4), each with a different sequence and linked to either Cy5 (green) or Alexa750 (red). Error bars represent the 95% confidence interval for the fit to an exponential decay shown in C for readout probe 1 and in Fig. S2A for readout probes 2–4.

