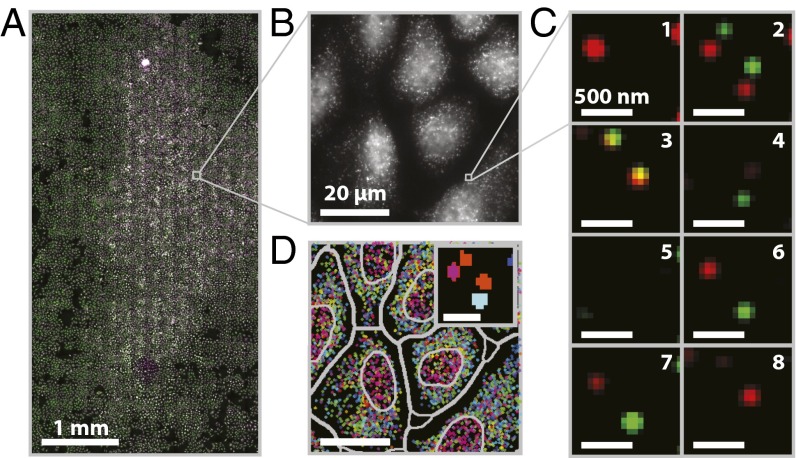
Fig. 3.
A MERFISH measurement of an ∼20 mm2 sample area (∼15,000 cells). (A) Mosaic image of a 3.2 × 6.2 mm region of cultured U-2 OS cells stained with DAPI (purple), encoding probes for 130 RNAs and a Cy5-labeled readout probe (green). (Scale bar: 1 mm.) (B) Image of the Cy5 channel in the first round of readout hybridization for the small portion of the field in A marked by the gray square. (Scale bar: 20 µm.) (C) Two-color images of the smFISH stains for all eight rounds of hybridization and imaging for the small portion of the field in B marked by the gray square after the application of a high-pass filter to remove background, deconvolution to tighten spots, and a low-pass filter to connect spots in different images more accurately (SI Materials and Methods). Green, red, and orange represent the Cy5 channel, the Alexa750 channel, and the overlay between the two, respectively. (Scale bars: 500 nm.) (D) The decoded barcodes for the region shown in B. Spots represent individual molecules color-coded based on their RNA species identities (barcodes). Both the nuclear boundaries and the boundaries used to assign RNAs to individual cells are depicted (gray). (Scale bar: 20 µm.) (Inset) An image of the barcode assignment (indicated by color) for each pixel in the images shown in C. (Scale bar: 500 nm.)

