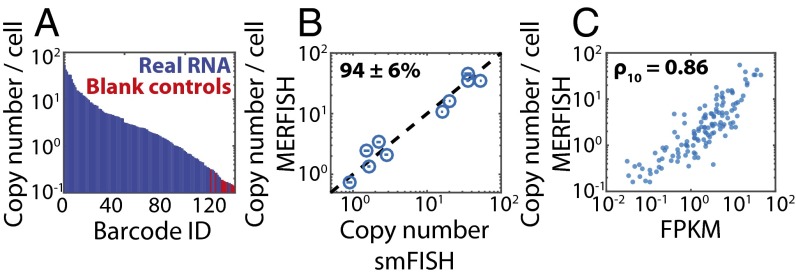
Fig. 4.
Performance of the high-throughput MERFISH measurements. (A) The average RNA copy numbers per cell measured in Fig. 3 sorted from largest to smallest abundance. Barcodes assigned to real RNAs are marked in blue, and those not assigned to RNAs, i.e., blank controls, are marked in red. (B) The average RNA copy numbers per cell determined via MERFISH vs. that determined via conventional smFISH for 10 of the 130 RNAs. The dashed line represents equality. The average ratio of counts determined by MERFISH to that determined by smFISH indicates a calling rate (mean ± SEM) of 94 ± 6% (n = 10). Plotted error bars represent the SEM across the number of measured cells (>300 cells) for each gene measured via smFISH. (C) The average RNA copy number per cell determined by MERFISH vs. the abundance as determined by bulk sequencing. The Pearson correlation coefficient between the log10 values (ρ10) is 0.86 with a P value of 6 × 10−39. FPKM, fragments per kilobase per million reads.

