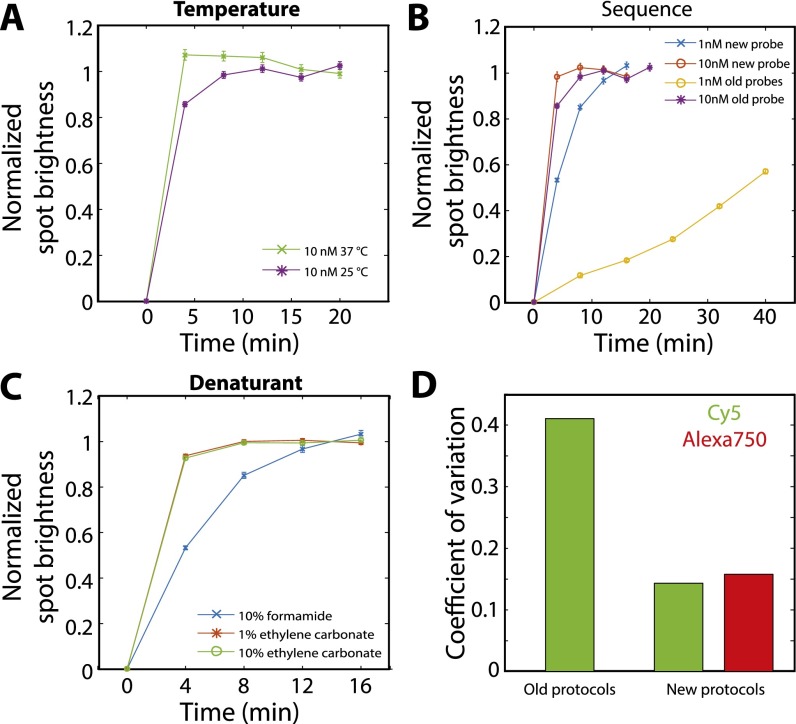
Fig. S3.
Characterization of the hybridization properties of different readout probes and different hybridization conditions. (A) The average normalized smFISH spot brightness for FLNA molecules labeled first with encoding probes and then with readout probes vs. the total time the sample is exposed to 10 nM of readout probes at 37 °C (green crosses) or at room temperature (25 °C; purple stars). The sequence of the readout probe is CGCAACGCTTGGGACGGTTCCAATCGGATC, which is one of our previously published readout probe sequences. The hybridization buffer is our previously published, formamide-based hybridization buffer (18, 23). (B) The average normalized smFISH spot brightness as in A but with the sample stained with 10 nM of a previously published 30-nt four-letter readout probe (purple stars; reproduced from A), 10 nM of a 20-nt three-letter readout probe (ATCCTCCTTCAATACATCCC) that does not contain G (red circles), 1 nM of the previously published 30-nt four-letter readout probe (orange circles), or 1 nM of a 20-nt three-letter readout probe (blue crosses). Hybridization was conducted at room temperature in the formamide-based buffer. (C) The average normalized smFISH spot brightness as in A for 1 nM of a 20-nt three-letter readout probe hybridized at room temperature but using different buffers: a hybridization buffer containing 10% formamide as described previously (18, 23) (blue crosses, reproduced from B), a hybridization buffer in which formamide was replaced with 1% (vol/vol) ethylene carbonate (red stars), or a hybridization buffer with 10% (vol/vol) ethylene carbonate (green circles). (D) The coefficient of variation (the SD divided by the mean) for the average brightness of smFISH spots across all rounds of imaging in the 16-bit MERFISH experiment conducted with the previously published 30-nt readout probes and formamide-based hybridization protocol (18, 23) (old protocols) and with the readout protocols published here (new protocols; 20-nt 3-letter readout sequence and an ethylene-carbonate–based hybridization protocol). Error bars in A–C represent SEM across all measured RNA spots; more than 10,000 RNA spots were measured for each data point.

