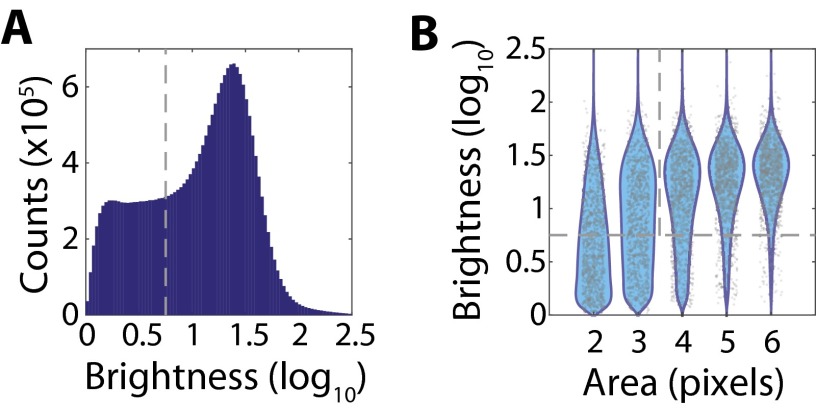
Fig. S4.
Thresholding of RNA signals based on area and brightness. (A) Histogram of the log10 brightness for all observed single-RNA-molecule signals from the data presented in Fig. 3. The gray dashed line defines the brightness threshold used to discard dim single-molecule signals that likely represent background rather than real RNA signals. (B) Scatter plot of the observed log10 brightness for single-molecule signals with a given area (gray markers), i.e., the number of contiguous pixels assigned to the same RNA molecule, with the associated probability distributions (cyan). For clarity, only 1,000 randomly selected single-molecule signals are plotted for each area. Note that single-molecule signals with smaller areas also tend to be low brightness. The gray dashed lines represent the cuts applied to separate spurious background signals from foreground RNA signals, i.e., a brightness greater than 100.75 and an area of four pixels or larger.

