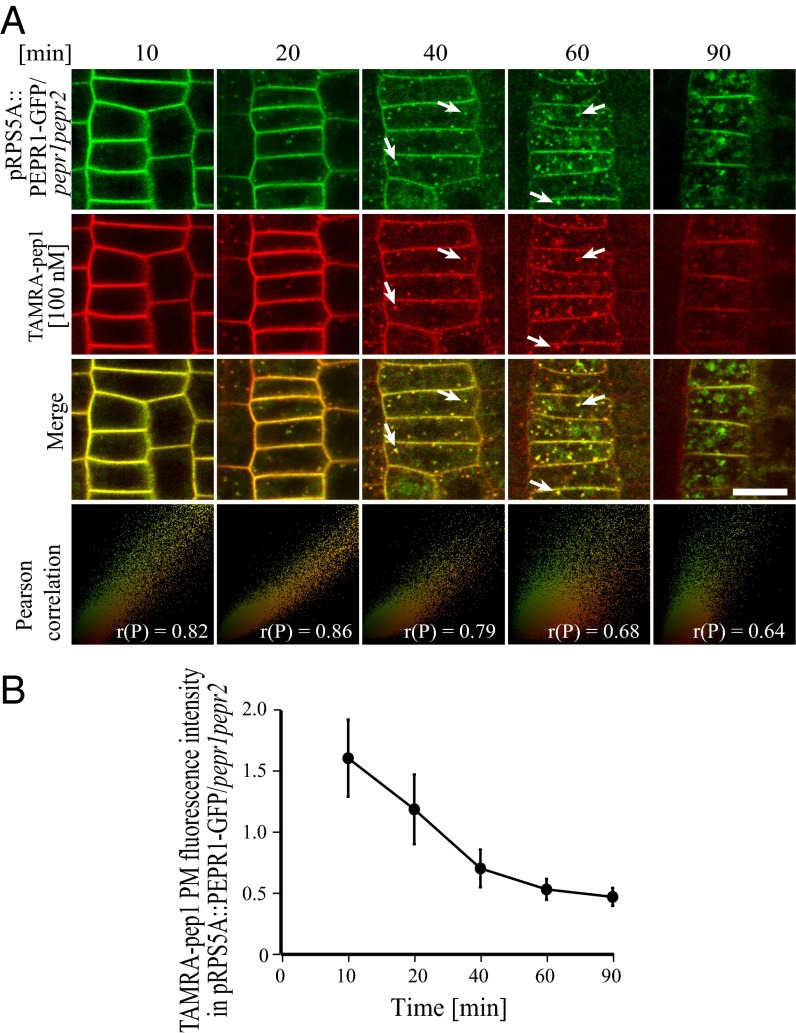
Fig. 2.
Internalization of AtPep1 and its receptor PEPR1. (A) Here 5-d-old pepr1pepr2 seedlings complemented with the pRPS5A::PEPR1-GFP construct were treated with TAMRA-pep1 for 10 s, washed with medium three times, and imaged at the indicated times. As a colocalization indicator, the Pearson correlation (P) was calculated for merged images. White arrows point to colocalized structures. (Scale bars: 10 µm.) (B) Quantification of PEPR1-GFP PM fluorescence intensity in A (n = 27). n, number of cells analyzed. Error bars indicate SD.

