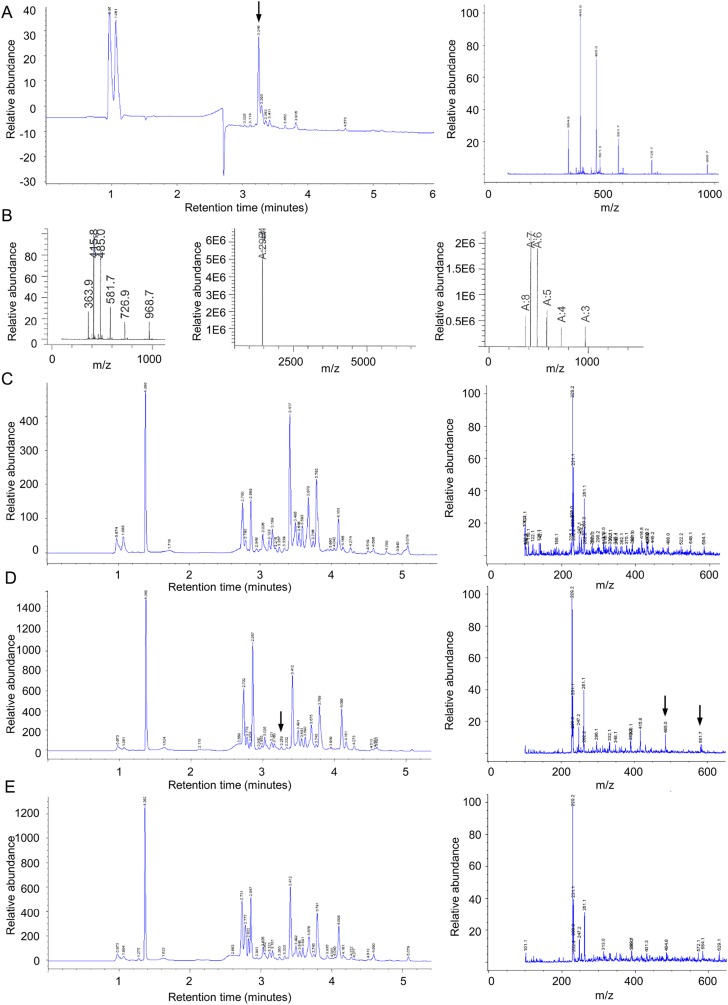
Fig. S1.
Identification of TAMRA-pep1 by LC-MS in plant tissues. (A) TAMRA-pep1 was first identified in the medium at a final concentration of 50 µM. (Left) Chromatogram at 254 nm showing the tagged peptide eluting at 3.25 min. (Right) LC-MS peak chromatogram of the fraction at 3.26 min. (B) The correct expected molecular weight of the TAMRA-pep1 (2,904) was assessed by a deconvolution procedure. (C–E) Chromatogram at 254 nm (Left) and LC-MS peak chromatogram at 3.26 min (Right) of pRPS5A::PEPR1-GFP–expressing root extracts not incubated with TAMRA-pep1 (mock control) (C) or incubated with the peptide (50 µM) for 1 h (D) or 2 h (E). Note that TAMRA-pep1 was not detected after 2 h. Arrows indicate TAMRA-pep1–specific peaks.

