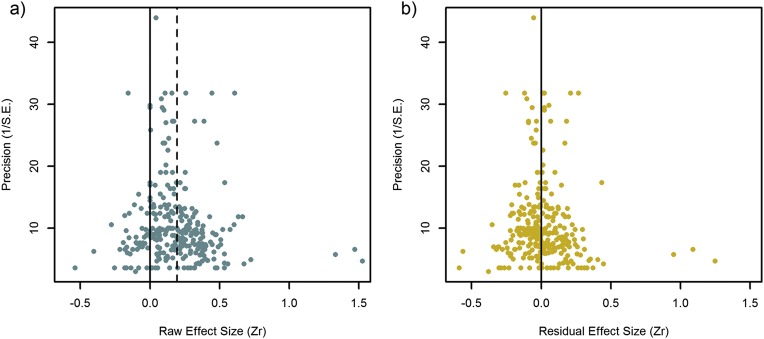
Fig. S1.
Funnel plots on (A) the raw effect sizes and (B) the metaregression residuals, taken from the averaged model (Table 2). Solid vertical line indicates zero, and dashed vertical line indicates overall weighted effect size from the intercept-only model. Asymmetry in the funnel plot, specifically missing null or negative effects at low precision (lower left corner of the funnel), would indicate publication bias. Even though there seem to be a few outliers with large effects at low precision, Egger’s test did not reveal significant asymmetry for any model, hence publication bias does not seem to be a concern for this field.

