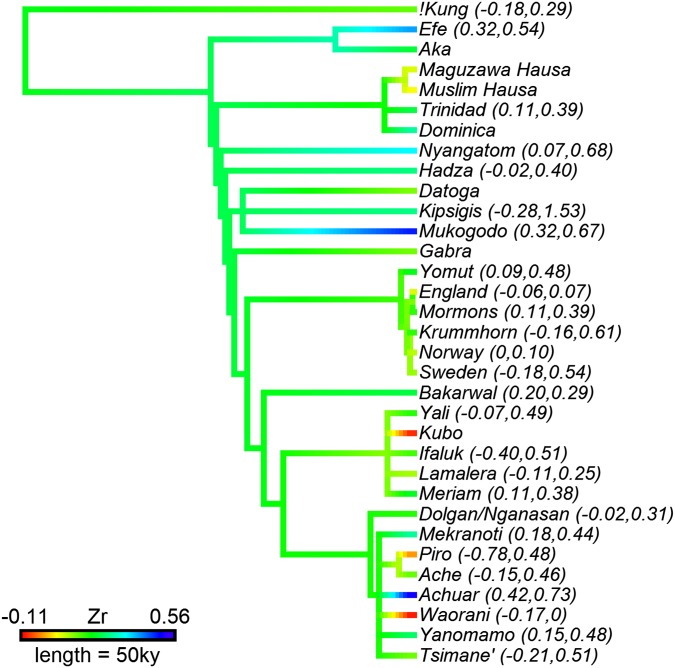
Fig. S2.
Phylogenetic tree of the study populations with average effect sizes color coded and ranges indicated in parentheses for populations with multiple measures. Values for ancestral branches represent maximum-likelihood estimates (100), and the length of the legend bar indicates 50,000 y. Consistent with the low phylogenetic signals found in the models, variation within populations can exceed total variation in average effect sizes (e.g., Krummhorn, Piro, and Tsimane), average effect sizes do not visibly cluster, and all ancestral branches are reconstructed at similar values; this suggests that the association between male status and fitness depends on current socioecological conditions and not (vertical) cultural transmission.

