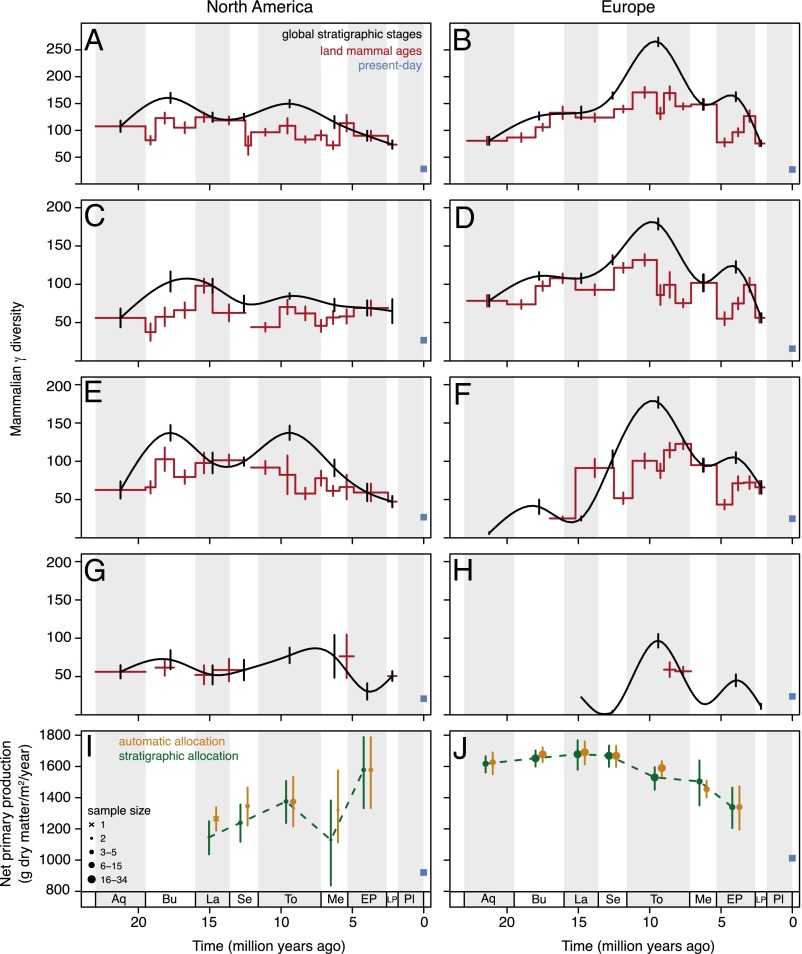
Fig. 2.
Temporal dynamics of Neogene mammalian diversity (A–H) and net primary production (J–K) in North America and Europe. (A and I) North America continent-wide. (C) Western North America. (E) Central North America. (G) Eastern North America. (B and J) Europe continent-wide. (D) Western Europe. (F) Eastern Europe. (H) Caucasus. Patterns of γ diversity for large terrestrial mammals (genus-level, first-order Jackknife estimation) are largely consistent in global stratigraphic stages (black trend line shows natural cubic spline interpolation; vertical bars indicate SEs) and continent-specific land mammal ages (red stepped line and error bars). Only time intervals with more than five mammalian locations are shown. Present-day observed genus richness (blue squares) is markedly lower than fossil diversity. The fossil NPP estimates in the two continents within stratigraphic stages (orange and green symbols; symbol size indicates the number of grid cell values underlying the estimate; error bars indicate the entire range between average minimum and maximum values across the grid cells) were very similar with two approaches to allocating paleoclimatic estimates to stratigraphic stages, i.e., whether paleobotanical records were assigned automatically following absolute dates given in source datasets (orange) or were assigned manually according to stratigraphic information in source datasets (green). Neogene estimates were generally much higher than the present-day estimates (potential NPP, blue squares with SEs too small to see). Stratigraphic stages (see Table S1): Aquitanian (Aq); Burdigalian (Bu); Langhian (La); Serravallian (Se); Tortonian (To); Messinian (Me); Early Pliocene (EP); Late Pliocene (LP); Pleistocene (Pl).

