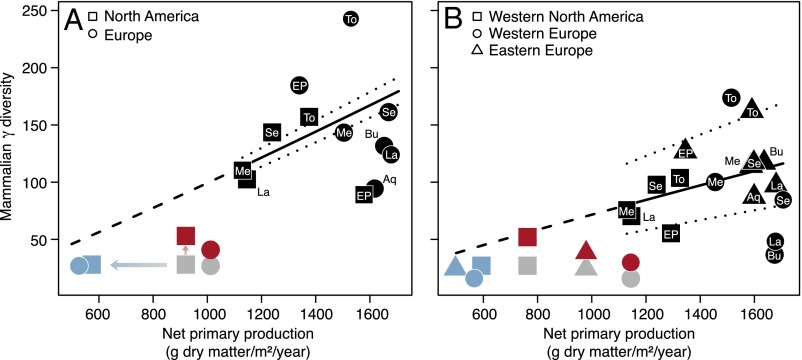
Fig. 3.
Models of the fossil mammalian diversity–productivity relationship in (A) continents and (B) focal regions across stratigraphic stages in the Neogene (black symbols) and visual comparison with present-day data (gray and colored symbols). GLMMs (black continuous lines) account for temporal and spatial data structure with random effects (dotted lines) and show consistent effects of NPP on fossil γ diversity. Black symbols represent mean conditional response values for stratigraphic stages (as in Fig. 2) predicted for median values of the fixed-effect covariates (Table 1). Present-day observed data (gray symbols), data adjusted for human appropriation of NPP (blue symbols), and data adjusted for end-Pleistocene and Holocene extinctions (red symbols) fall below the fossil model predictions (dashed lines).

