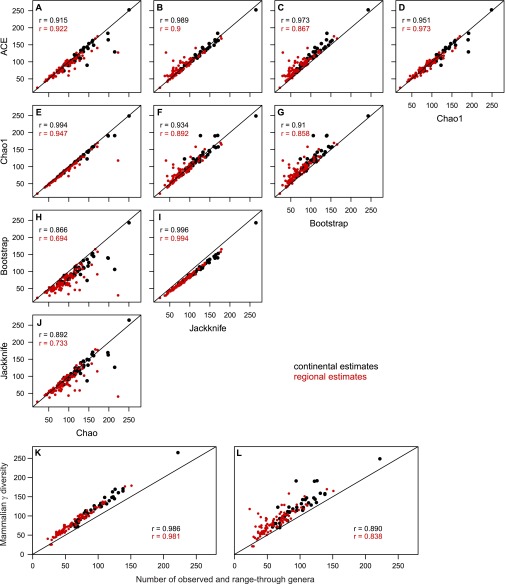
Fig. S2.
Estimation of mammalian diversity with different richness estimators. (A–J) Matrix of scatter plots comparing γ diversity estimates for large terrestrial mammals through the Neogene, generated with five different richness estimators: the two richness estimators based on occupancy within continents or regions (A–D, ACE; D–G, Chao1) and the three estimators based on presence–absence location matrices for each continent or region (C and G–I, Bootstrap; B, F, I, and J, first-order Jackknife; A, E, H, and J, Chao). (K and L) Scatter plots of the relationship of γ diversity values, which were estimated with first-order Jackknife (K) and Chao1 (L), with the sum of observed genera and range-through genera (i.e., genera with an occurrence gap for that single time interval). Each plot shows all continental (black) and regional (red) diversity estimates within each time interval with more than five mammalian locations (stratigraphic stages and land mammal ages), Pearson’s correlation coefficients across continental and regional estimates, and the 1:1 line.

