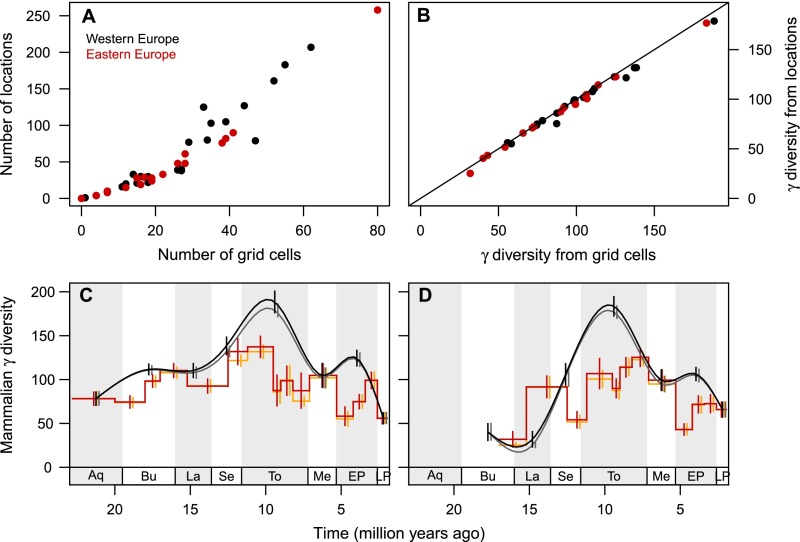
Fig. S3.
Effects of location definition on the estimation of mammalian diversity. (A) Scatter plot showing the number of fossil locations that were spatially grouped into 1° grid cells (compare with Fig. 1) in Western Europe (black) and Eastern Europe (red). (B) Scatter plot showing that mammalian γ diversity estimates (first-order Jackknife) based on fossil locations and on 1° grid cells were strongly correlated in Western Europe (black) and Eastern Europe (red) across time intervals with more than five mammalian locations or grid cells (the 1:1 line is shown for comparison). (C and D) The temporal dynamics of Neogene mammalian diversity in Western Europe (C) and Eastern Europe (D) as estimated based on either the 1° grid cells (black and red lines; vertical bars indicate SEs) or on the original fossil locations (gray and orange lines with SE bars moved to the right to facilitate comparison). Patterns of γ diversity were very similar with the two location definitions and were largely consistent in stratigraphic stages (black and gray symbols; trend lines fitted by natural cubic spline interpolation) and MN units (red and orange stepped lines and error bars). For stratigraphic stages and MN units see Fig. S1 and Table S1.

