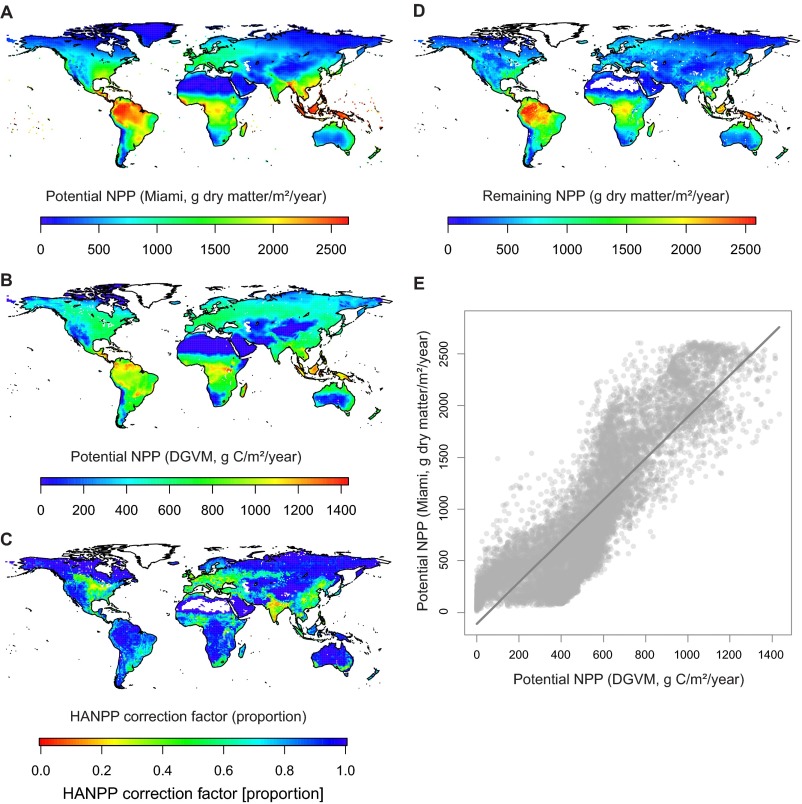
Fig. S6.
Global variation of present-day NPP and its human appropriation and comparison of the Miami model with a DGVM. (A–D) Global maps showing different measures of present-day NPP in 1° latitudinal–longitudinal grid cells. (A) Potential NPP calculated from temperature and precipitation with the Miami model. (B) Potential NPP derived from a DGVM. (C) Correction factor for HANPP, calculated as the proportion of potential NPP (estimated with the DGVM, B) that remains after human modification and harvest. (D) Remaining NPP adjusted for human appropriation, derived by multiplying the Miami-model NPP values by the HANPP correction factor. (E) Scatter plot showing a strong global relationship across 1° grid cells (linear regression model: adjusted R2 = 0.77, slope estimate = 1.96, P < 0.001) between present-day potential NPP values derived from the Miami model (A) and the DGVM (B). Symbols are semitransparent to show overlapping data points.

