Fig. 2.
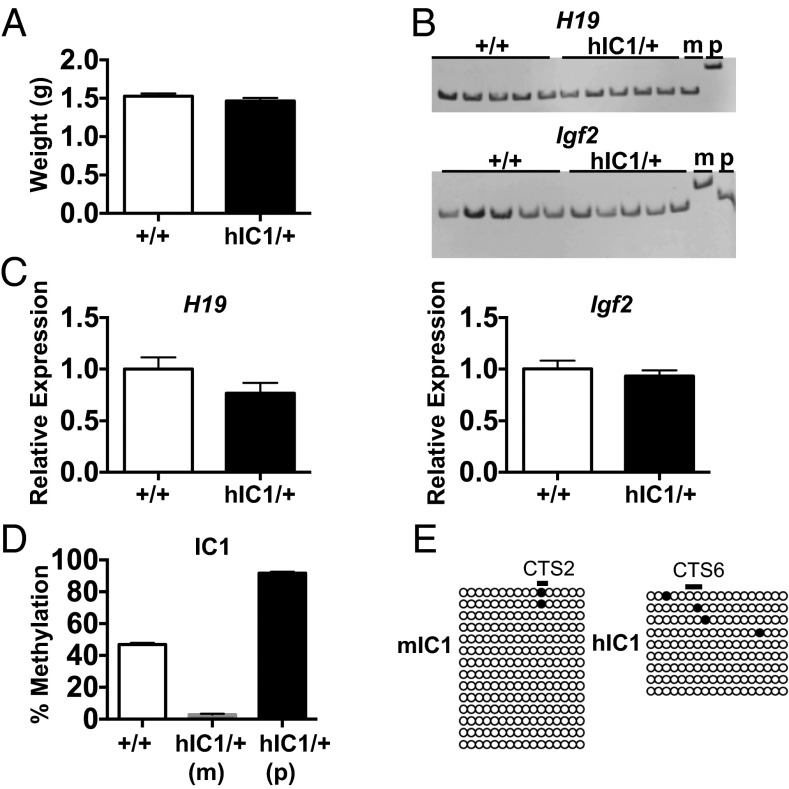
Maternal transmission of the H19hIC1 allele. (A) Neonatal (P0) weight of wild-type (+/+) and hIC1/+ mutant offspring. (B) Allele-specific expression of H19 and Igf2 in neonatal liver analyzed by restriction fragment length polymorphism (RFLP). Genotypes (wild-type and hIC1/+) and maternal (m) and paternal (p) allele controls are indicated above each gel. (C) Total expression of H19 and Igf2 in neonatal liver analyzed by qRT-PCR. (D) Percent methylation at IC1 in neonatal liver measured by pyrosequencing. Maternal (m) and paternal (p) alleles in hIC1/+ are shown separately, because different primers were used. Assay d was used for the wild-type (+/+) and hIC1/+(p), and assay l was used for hIC1/+(m) (Fig. 1C). (E) IC1 methylation in oocytes analyzed by bisulfite treatment followed by sequencing. Assay a was used for mIC1, and assay m was used for hIC1 (Fig. 1C). Empty and filled circles indicate unmethylated and methylated cytosines in CG dinucleotides, respectively. Each horizontal row of circles denotes individual strands of cloned DNA. Cytosines in CG dinucleotides that are conserved between mouse and human and located within the CTS are depicted as black lines above the clones and marked as CTS2 and CTS6 (13). In A and C, two-tailed Student's t test with equal variance was used; no significant differences were observed. In A–D, wild-type (+/+), n = 11; hIC1/+, n = 12 (from three litters). Bars represent the mean ± SEM; error bars in A and D are too small to be visible on the graph.

