Fig. 3.
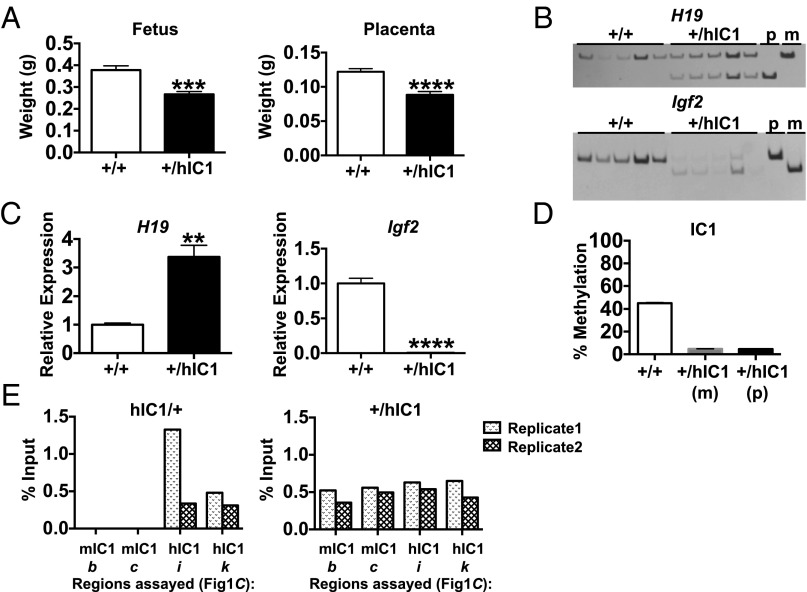
Paternal transmission of the H19hIC1 allele. (A) E15.5 fetal and placental weight of wild-type (+/+) and +/hIC1 mutant offspring. (B) Allele-specific expression of H19 and Igf2 in E15.5 livers analyzed by RFLP. PCR cycle numbers varied between wild-type (+/+) and +/hIC1 for Igf2 (Table S1; see Table S2 for primers). (C) Total expression of H19 and Igf2 in E15.5 livers analyzed by qRT-PCR. (D) Percent methylation at IC1 in E15.5 livers measured by pyrosequencing. Assay d was used for wild-type (+/+) and +/hIC1(m), and assay l was used for +/hIC1(p) (Fig. 1C). (E) CTCF binding at mIC1 and hIC1 in heterozygous (hIC1/+ and +/hIC1) E12.5 MEFs analyzed by ChIP–qRT-PCR. Assays b, c, i, and k were used (Fig. 1C); results from two biological replicates are shown separately. The y-axis denotes percent input of CTCF IP normalized to nonspecific IgG (percent input of CTCF − percent input of IgG). **P < 0.01; ***P < 0.001; ****P < 0.0001, two-tailed Student's t test with equal variance (A) or unequal variance (C). In A–D: wild-type (+/+), n = 8; +/hIC1, n = 6 (from two litters). Bars represent the mean ± SEM; error bars in D are too small to be seen on the graph.

