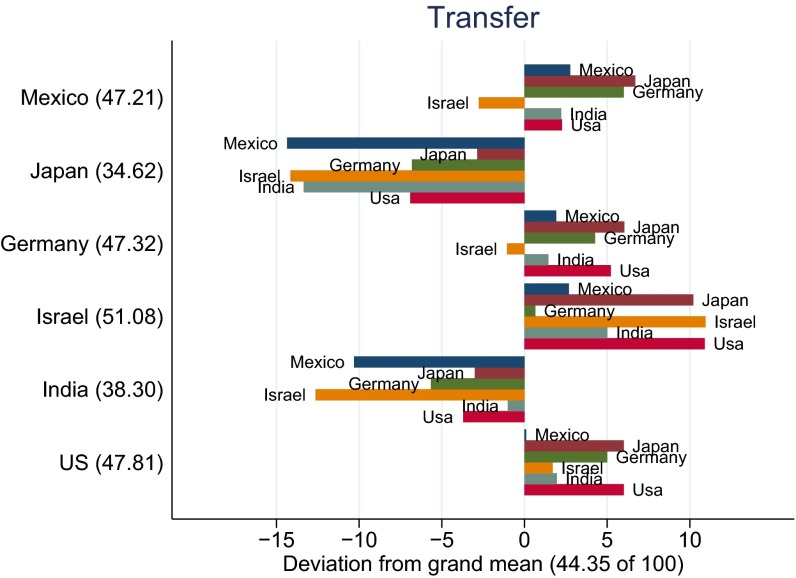
Fig. 2.
Transfers for all combinations of sender and receiver countries in study 1. Transfer scores are presented as the difference from the grand mean (44.35 of 100 US cents). The y axis depicts the sender country, whereas the bar colors and labels represent receiver nationality. The numbers in parentheses indicate the mean contribution for each sender nation.

