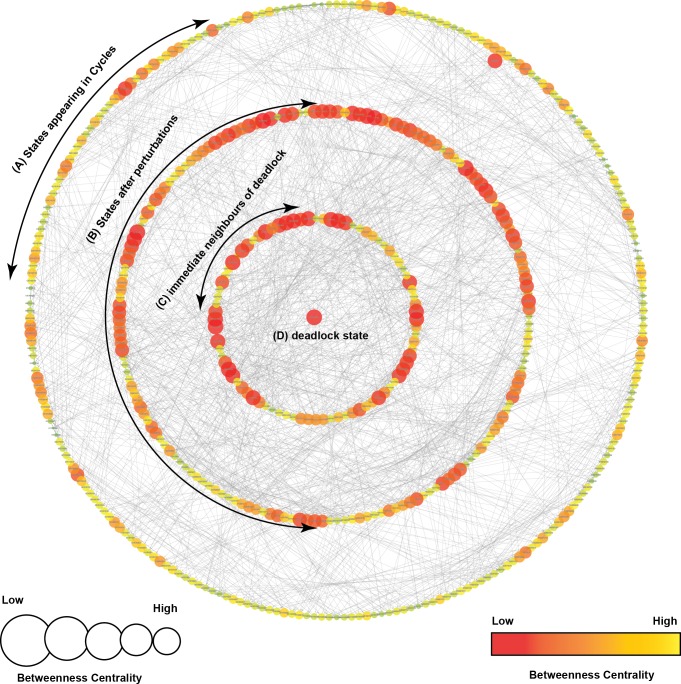
Figure 5. State Graph (rendered using Cytoscape) with 512 nodes and 2,304 edges.
Each node in the graph, shown as a circle, represents a unique state characterized by the expression levels of individual genes. The size and color of each state is defined based on its betweenness centrality. (A) This outermost circle represents the states appearing in cycles. (B) Once the system is perturbed, it diverges to several bifurcation states that can either lead to deadlock or recovery, dependent on signaling events. Compared to the outermost circle, (C) neighboring states and (D) the deadlock state have lower betweenness centrality.

