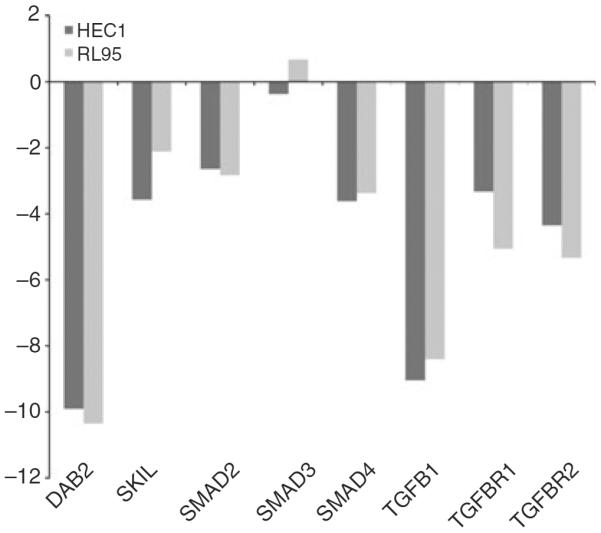
Figure 2.

Bar plots showing the mRNA levels of Smad2, Smad3, Smad4, transforming growth factor (TGF)-β1, TGF-β receptor type I (TβRI), TGF-β receptor type II (TβRII), Skil and DAB2 in each of the HEC1 and RL95 cancer cell lines as compared with normal endometrial tissue.
