
Figure 2.
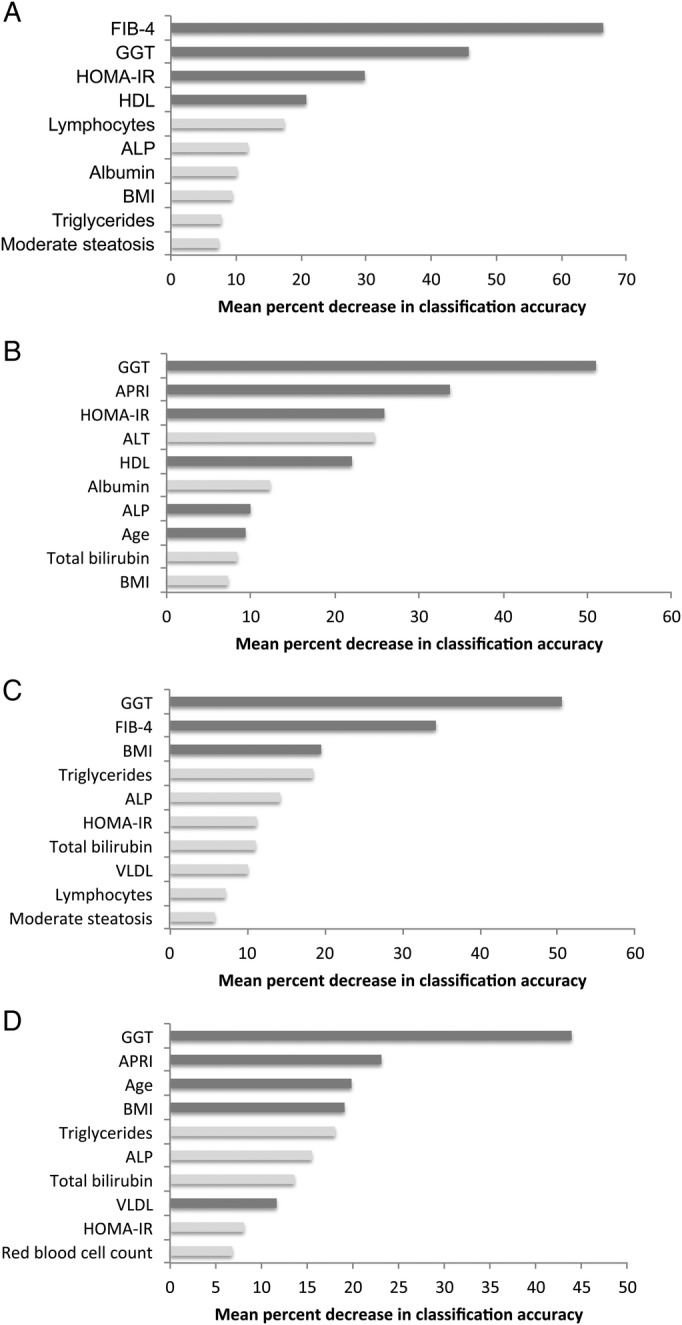
(A) Variable importance plot of FIB-4 random forest model predicting severe liver stiffness (≥12.3 kPa). (B) Variable importance plot of aminotransferase to platelet ratio index (APRI) random forest model predicting severe liver stiffness (≥12.3 kPa). (C) Variable importance plot of FIB-4 random forest model predicting at least significant liver stiffness (≥8.5 kPa). (D) Variable importance plot of APRI random forest model predicting at least significant liver stiffness (≥8.5 kPa). Only the 10 most important variables are shown. Dark gray bars indicate overlap with best subset logistic regression model.