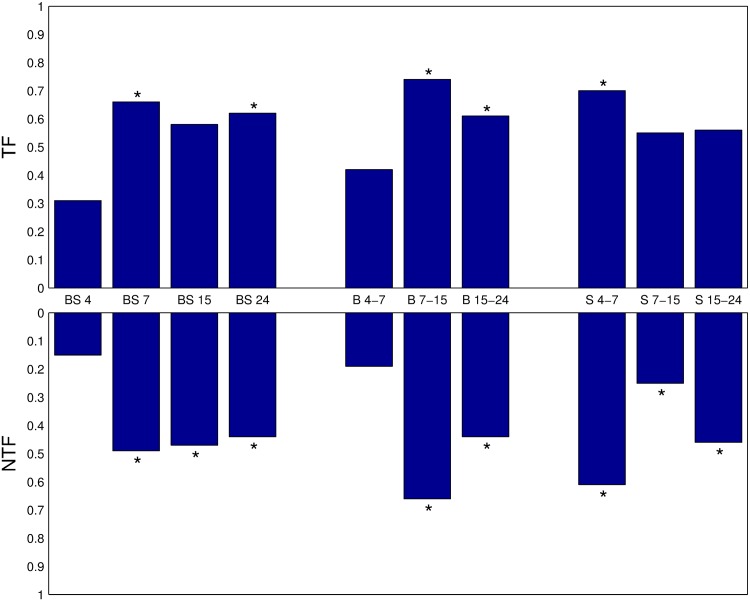
Fig 2. Statistical significance of RGD variation.
Fraction of genes with RGD < 1.0 for genes participating in at least one graphlet comparing different conditions and time points. BS: biofilm versus suspension, for all four time points analyzed. B: biofilm, at consecutive time points. S: suspension, at consecutive time points. TF: genes coding for TFs. NTF: genes non coding for TFs. Statistically significant P-values obtained from a one way ANOVA test (0.05 threshold) are marked with an ∗ .

