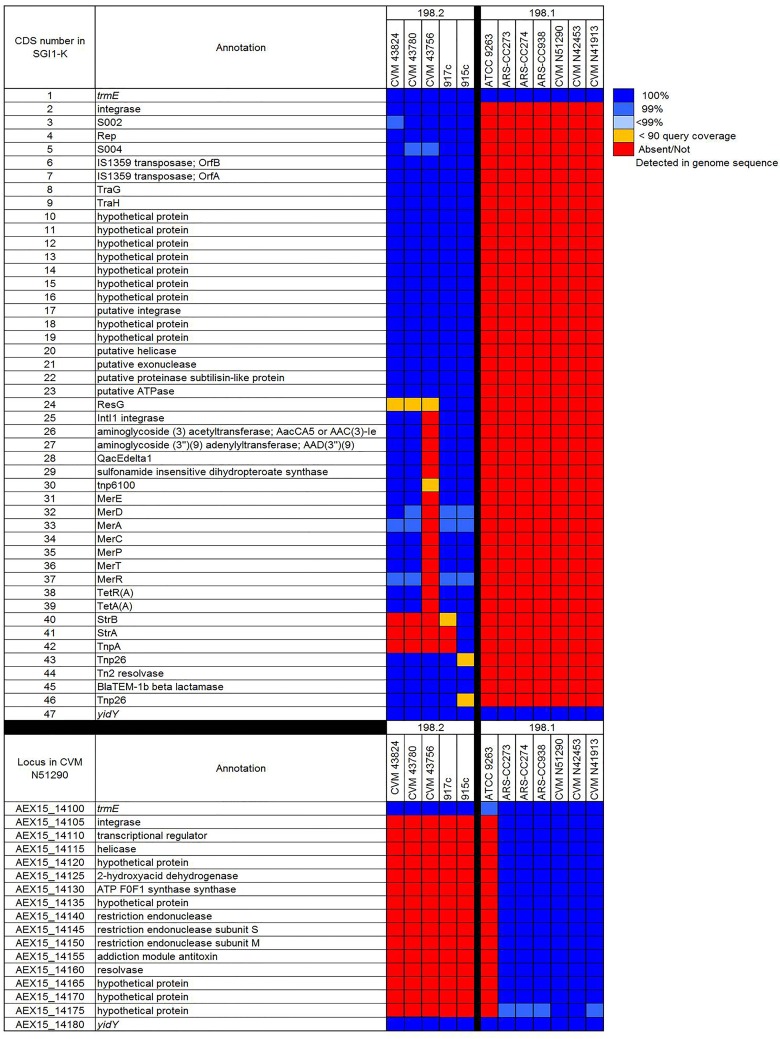
Fig 11. BLASTN comparison of SGI1-K against the ST198 genomes (Top).
Blue squares indicate level of similarity, red squares indicate that homologs were not detected in the query genome sequence, orange squares = homolog was identified but at < 90% coverage. BLASTN comparison of a ca. 17 kb region inserted at the trmE-yidY locus in cluster 198.1 genomes (Bottom).

