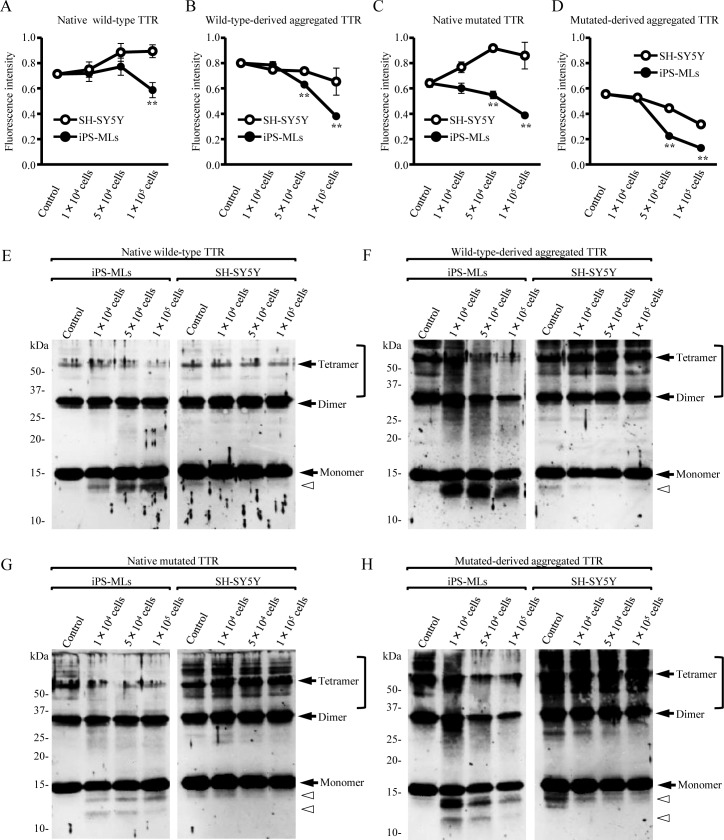
Fig 5. iPS-MLs degrade aggregated TTR.
(A-H) iPS-MLs or control SH-SY5Y cells (1 × 10⁴, 5 × 10⁴, or 1× 10⁵ cells/well) were cultured with native wild-type, mutated TTR, wild-type-derived, and mutated-derived aggregated TTR for 3 days. Detection of TTR in each culture supernatant was determined by ELISA (A-D) or western blot analysis (E-H). (A-B and E-F) Native wild-type and wild-type-derived aggregated TTR. (C-D and G-H) Native mutated and mutated-derived aggregated TTR. (A-D) Tukey post-hoc test after separate two-way repeated-measures analysis of variance. **p < 0.01. Data are representative of two independent experiments. (E-H) Black arrows and white arrowheads indicate full-length TTR and truncated TTR, respectively. Square brackets indicate polymerized TTR. Mutated TTR represents V30M TTR.

